Complaints for Neglected Dog Waste on the Rise
We’ve all been there, enjoying a beautiful spring day, maybe walking to meet some friends for dinner. Suddenly – SQUISH – oh no! In a split second there’s a rush of emotions: anger, sadness, embarrassment, and nausea. Who are these degenerates that don’t pick up after their furry little friends? While we can’t tell you who they are, using Chicago’s data on Sanitation Code Violations Requests and some data science, Renthop can tell you when and where they are.
A Quick Summary of our Findings:
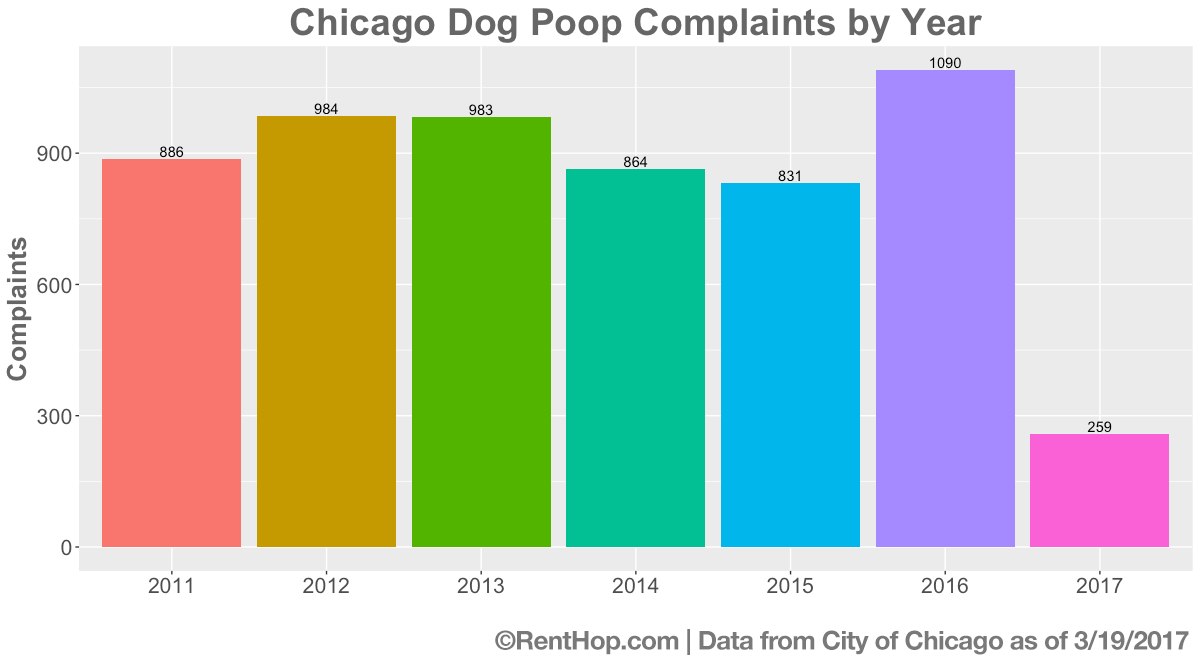
- 2016 was the worst year on record for complaints, but 2017 is on track to beat that
- Tickets were up 31.2% from 831 in 2015 to 1,090 in 2016
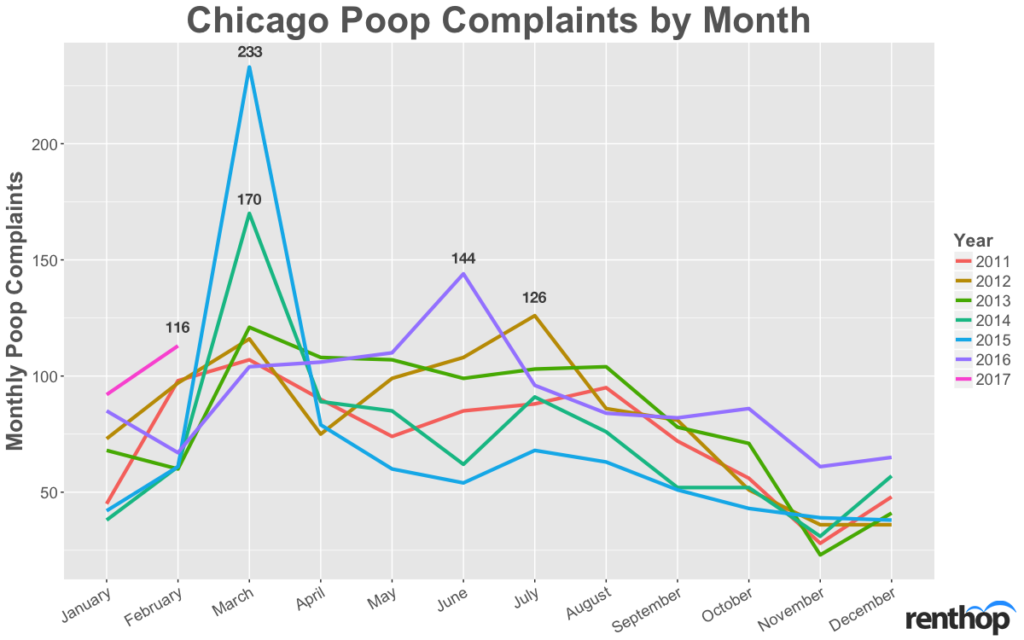
- March is the busiest month
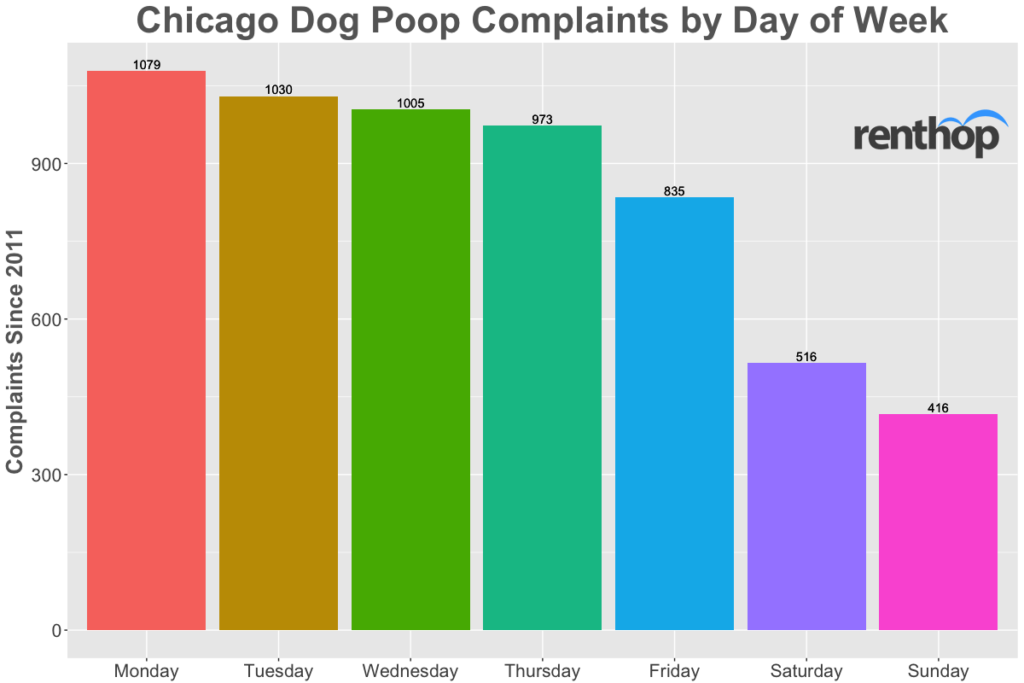
- Mondays are the busiest days, followed closely by Tuesday, Wednesday
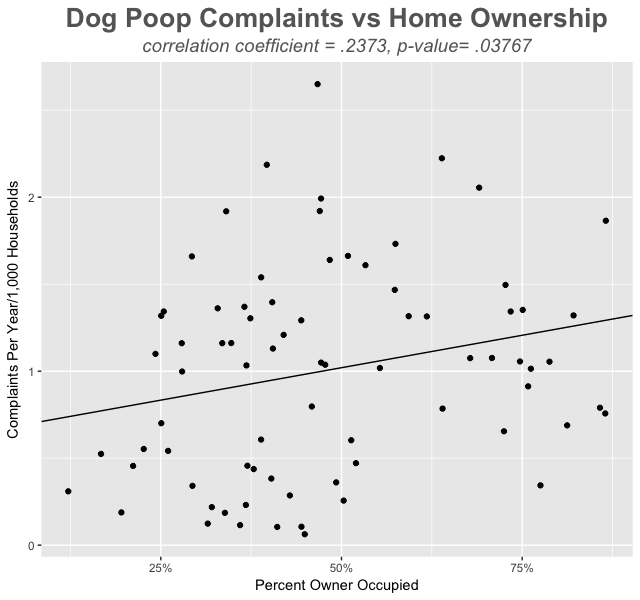
- Neighborhoods with a higher proportion of owner-occupied housing (less rentals) complain more
- West Englewood gets the most complaints, followed by West Pullman
- The Near North Side gets the least complaints, followed by The Loop
Why Complain?
The more obvious reason, is of course, it stinks! It’s gross to look at, and even worse to smell and especially to step in. Less obviously, dog waste is a primary source of food for rodents. One could make a case that rats are even more disgusting than dog poop, since they carry diseases and reproduce. The official note from the city regarding these types of violations is simply “Dog Feces in Yard”. This may refer to someone complaining about the smell coming from a neighbor’s yard or that someone else’s dog’s poop is in their yard. It’s such a big deal that some have even gone to drastic measures like DNA testing the poop to prove whose dog it came from.
Where to Watch Out
One might think there’s no science in poop complaints, but we found a lot of interesting trends. The first thing we noticed were correlations between neighborhood and the number of complaints. Neighborhoods further from downtown had a significantly higher number of complaints. This can be seen in the map below.
Darker shaded areas have higher concentrations of poop complaints. To rank fairly, we normalized complaints by the number of households in a neighborhood, according to the most recent Census data available. This allows us to fairly compare one neighborhood to another, because one would assume that an area with more apartments will also have more complaints, and this will correct that. We also removed duplicate complaints, so repeated same day callers about the same poop won’t tilt the data.
![]()
These areas were the worst offenders / complained the most
- West Englewood – 26.5 Average Yearly Complaints / 10,000 Households – 25 Complaints in 2016
- West Pullman – 22.2 Average Yearly Complaints / 10,000 Households – 13 Complaints in 2016
- Hermosa – 21.9 Average Yearly Complaints / 10,000 Households – 23 Complaints in 2016
- Washington Heights – 20.5 Average Yearly Complaints / 10,000 Households – 23 Complaints in 2016
- Auburn Gresham – 19.9 Average Yearly Complaints / 10,000 Households – 35 Complaints in 2016
These neighborhoods had the most responsible dog owners / complained the least
- Near North Side – 0.63 Average Yearly Complaints / 10,000 Households – 5 Complaints in 2016
- The Loop – 1.05 Average Yearly Complaints / 10,000 Households – 1 Complaint in 2016
- O’Hare – 1.06 Average Yearly Complaints / 10,000 Households – 0 Complaints in 2016
- Hyde Park – 1.15 Average Yearly Complaints / 10,000 Households – 3 Complaints in 2016
- Kenwood – 1.24 Average Yearly Complaints / 10,000 Households – 1 Complaint in 2016
What kinds of neighborhoods are most affected?
Besides geographical location and proximity to downtown, we also looked at a few other factors that may affect complaints. We checked for a correlation between median age and saw almost no relationship. When we looked at the relationship between whether a household was owned or rented, we found a trend.
There was a statistically significant correlation (r = .2373) between the percentage of homes in neighborhood being owner occupied instead of renter occupied. With p = .03767 it is very unlikely that this is a coincidence (whenever p ≤ .05 it is likely not a coincidence). Of course, correlation does not equal causation, but we do get a glimpse into what types of neighborhoods generate complaints. Maybe homeowners are more likely to complain than a renter is? Or maybe homeowners are more likely to have dogs. One cannot say from the available data.
When to Watch Out
Since predicting where you’ll find dog poop wasn’t enough, we dug even deeper. Did you know that March has been historically the top month for complaints? It seems that as snow thaws little poopsicles reveal themselves. The blue spike on the graph shows March 2015, the month the city received more complaints (233) than any other time period.
The overall low volume of complaints may be attributed to people not knowing that they can make complaints, while others may have simply gotten used to seeing poop on the ground. Things change when an article like the one on March 10, 2015 by DNAinfo raises awareness. March 10, 2015 ended up being the highest complaint day ever(so far), with 67 unique complaints. That’s more than double the second busiest day, June 4, 2016, when 29 unique complaints were made.
We also broke down complaints by day of the week
We found Mondays to be the busiest day, followed closely by Tuesday and Wednesday. It looks like people take a break from calling in (or going online) and making complaints over the weekend, but once Monday comes, they’re not going to put up with that sh**.
One might also infer that dog owners are lazier or too busy to pick up after their dogs during the week, which is certainly possible. We’ve chosen to reject the conclusion that the dogs themselves actually produce more poop early in the week, but maybe with more data we could reconsider.
If you’re in the market for a new Chicago apartment, we hope this RentHop study can serve as a resource for you to find one that’s low-poop. Check out our 1,000’s of great fee and no-fee apartments in Chicago.


