The Bay Area is known for its limited housing options and high rent growth. While high-paying tech jobs are one of the reasons why rents are so high, the level of construction is also key. Similar to what we did for the City of Los Angeles, we looked into the building data released by San Francisco and San Jose, to see where construction has been concentrated, whether housing supply is meeting the demand, and how rents have gone up.
We found that
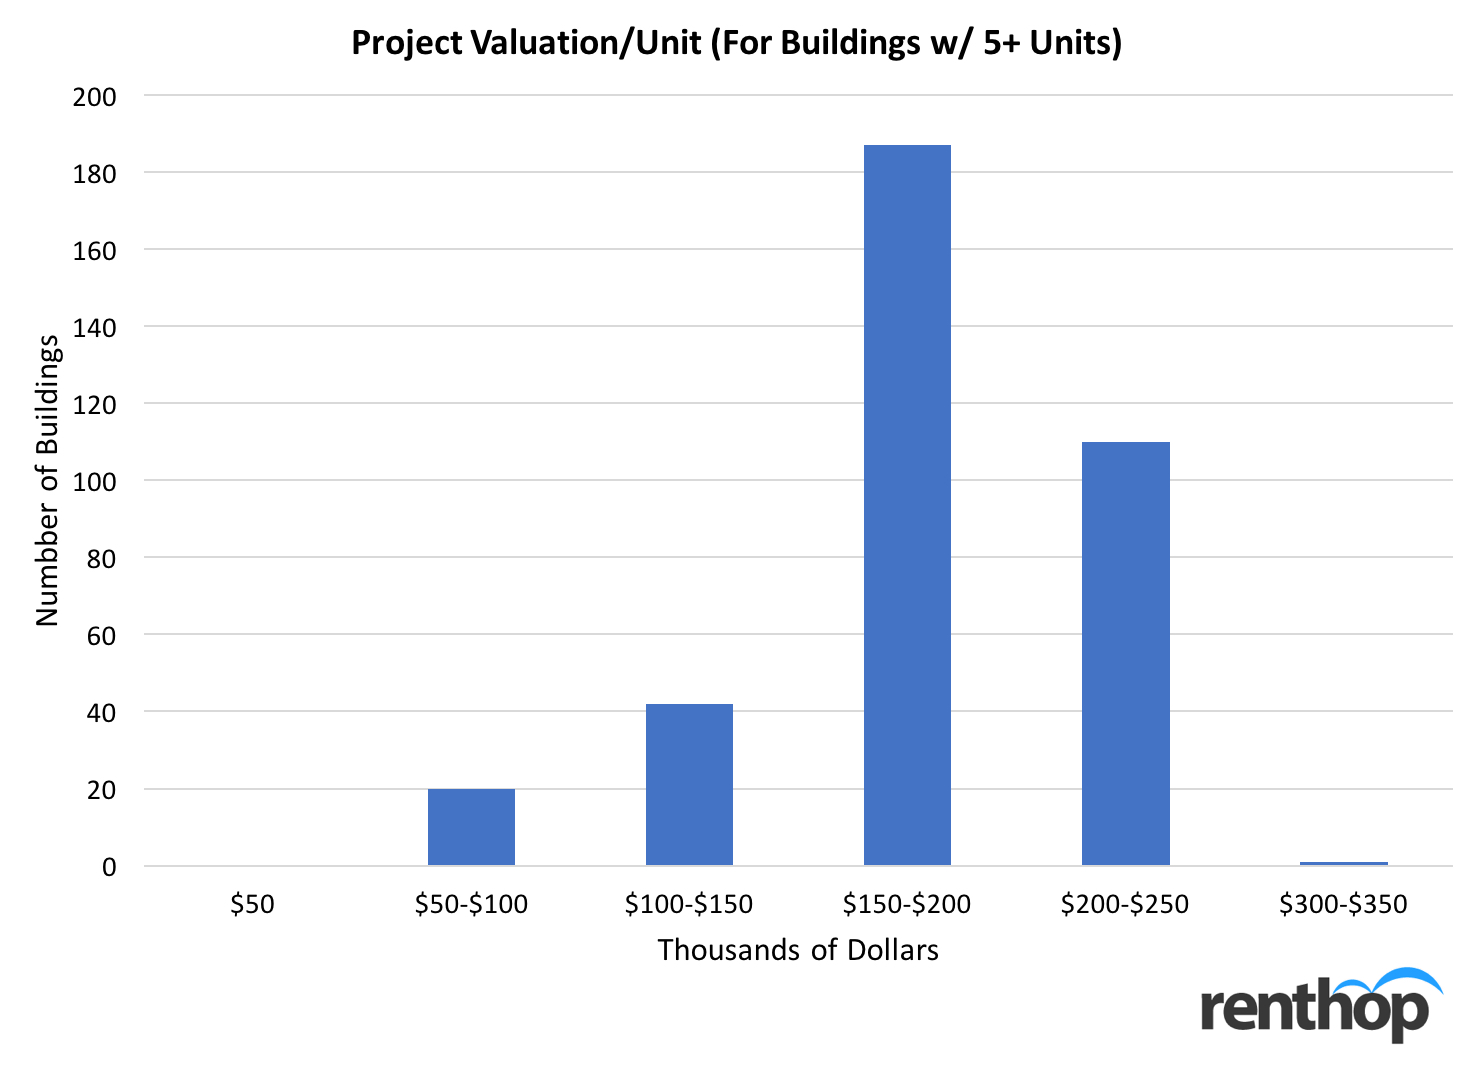
- Most of the residential inventory built the past two years was in the Downtown San Jose area. The median cost for each multi-family unit was on the higher end, being in the $150 to $200 thousand range.
- North San Jose/Berryessa has seen some momentum in 2017, with 100 units permissioned, compared to 12 units in 2016, and 1 unit in 2015. This is possibly related to the BART San Jose Extension.
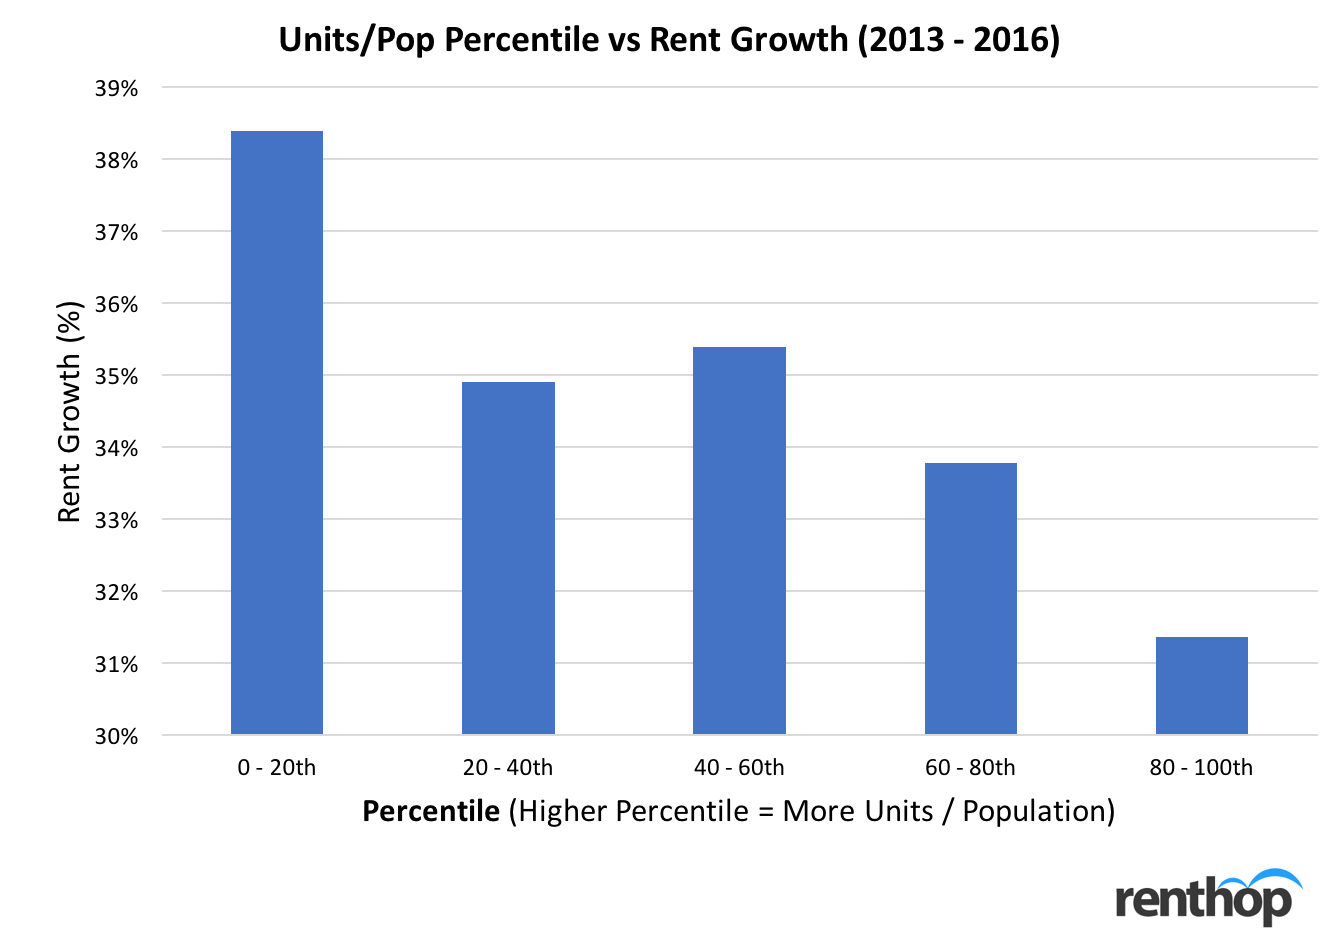
- In San Jose, zip-codes where the lowest number of units were built (lowest 20th percentile) experienced rent growths of roughly 7 percent higher than zip-codes with the highest number of units built (top 20th percentile) from 2013 to 2016.
- A majority of the new residential units in San Francisco have (and will) be concentrated in the Northeast area (SoMa, Inner Mission, and South Beach) since 2011. Specifically, new units will be concentrated in SoMa (South of Market) in the coming couple of years.
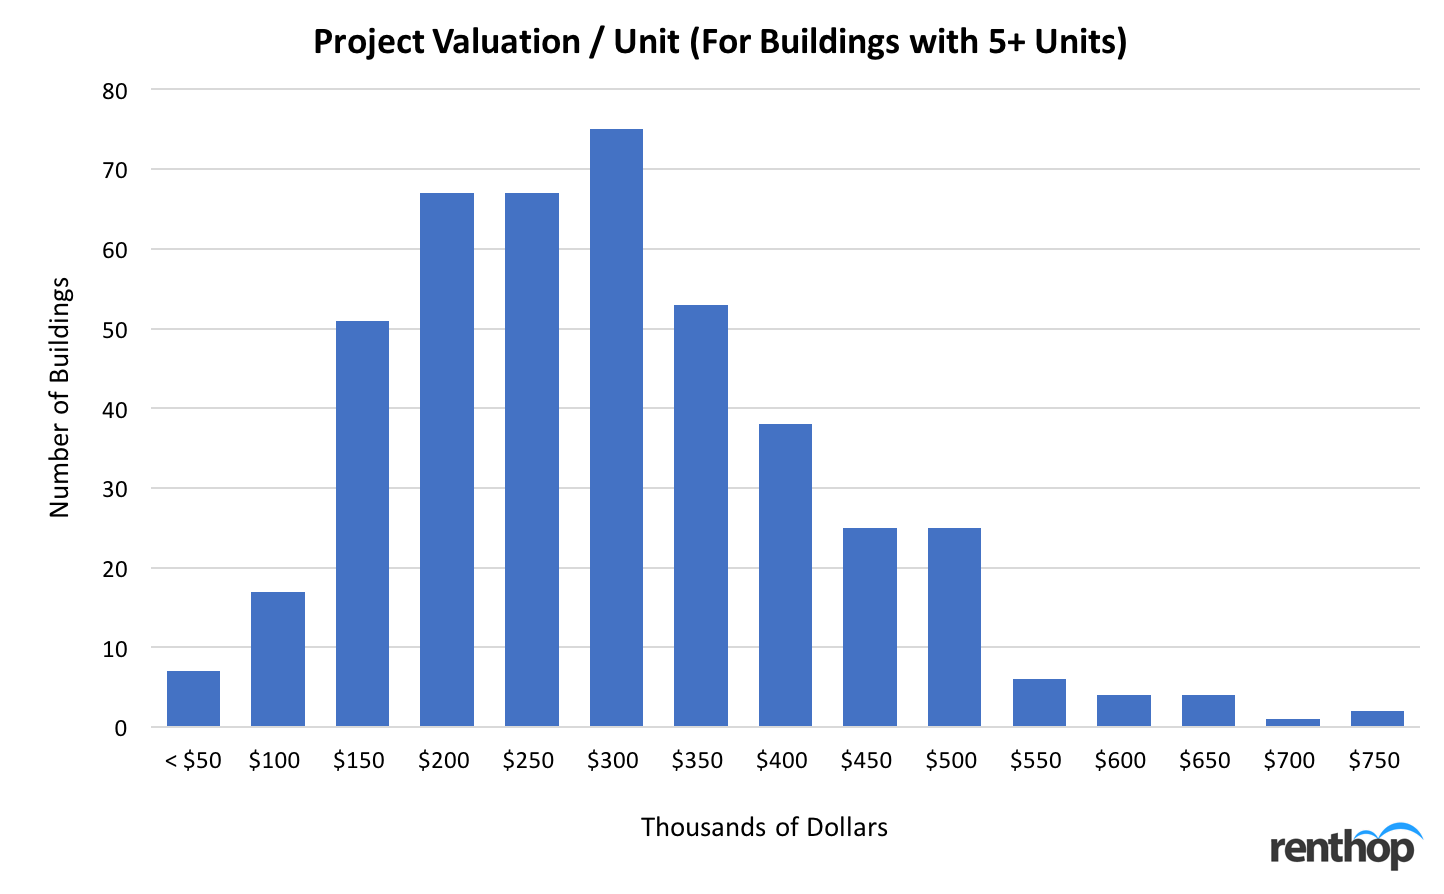
- Much of the new residential inventory permissioned and constructed tend to be in the luxury range. The construction value of the projectsa are in the $150 – $350 thousand/unit range.
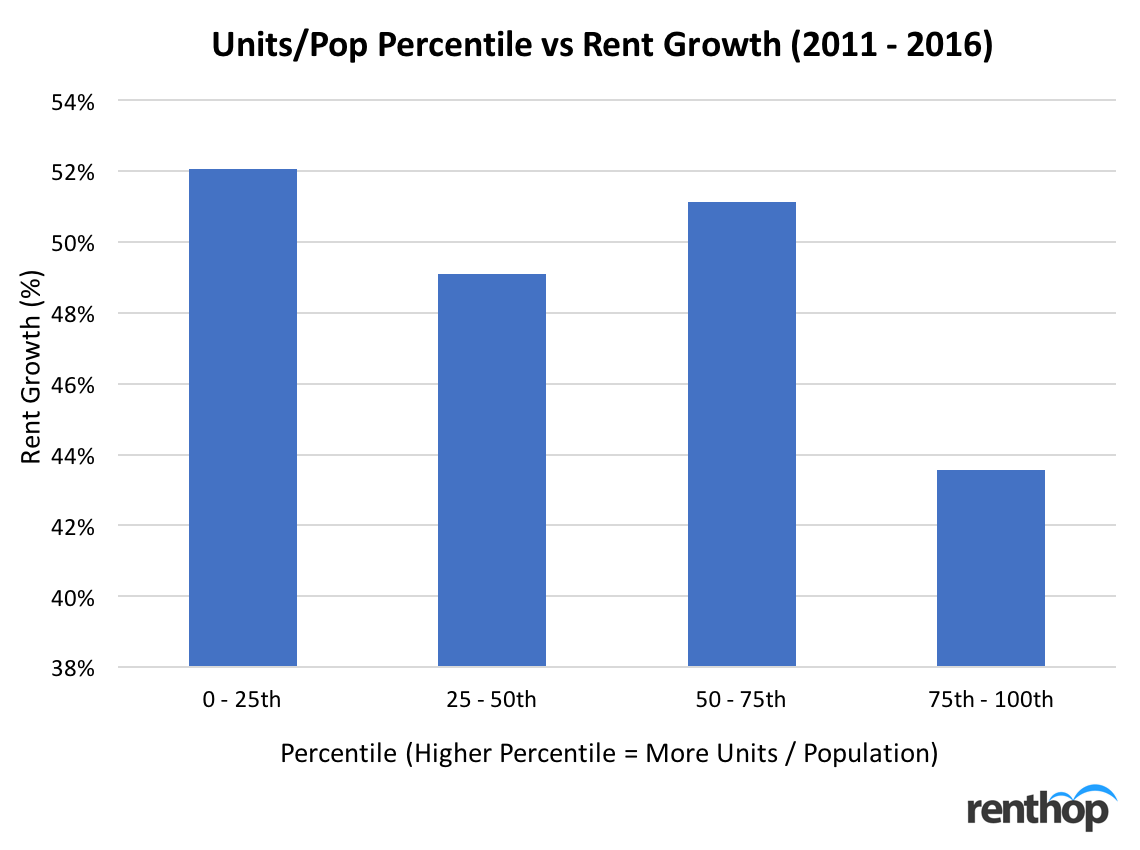
- In San Francisco, zip-codes where the lowest number of units were built experienced rent growths of roughly 8 percent higher than zip-codes with the highest number of units built from 2011 to 2016.
***
San Jose
Let’s first look at where construction has been concentrated, and the 2017 data (as of November) especially gives a decent indication on where new housing supply will likely pop up in 2018 and later (since it takes roughly one year between permit and occupancy).

Blossom Valley has been one of the most popular neighborhoods for construction in the past five years (specifically between 2013 and 2015). However, the past couple of years, a majority of the new residential units have been concentrated in the Downtown/Fairgrounds area (even adjusting for population), and it seems that most of the construction will be concentrated in this neighborhood in the coming year or two. In addition, construction in North San Jose/Berryessa is also catching up. This could be related to the BART Sillicon Valley extension, and in the next couple of years we expected to see more construction in this neighborhood.
While single-family houses and suburban family lifestyle are still the mainstream in San Jose, new construction is flowing into the zip-code 95113 area, with around 30 units per 1000 population level every year in the past two year, and the construction value of the projects (for multifamily buildings with 5+ units) are in the $150 – $200 thousand/unit range, followed by the $200 – $250 thousand/unit range. This reflects the current rental price level in the San Jose area. With Google’s plan to build a massive new campus in the capital of Sillicon Valley, we expect to see strong rent growth and more construction flowing into Downtown San Jose in the coming few years.
 In terms of how much this new construction has potentially impacted rents, we found that between 2013 and 2016, zip-codes in the lowest 20th percentile of permits and construction experienced the highest rent growth (an average of 7 percent higher than rent growth zip-codes in the top 20th percentile). This finding is consistent with the fact that lack of construction does put an upward pressure to the rental prices.

It is important to point out that most of the hottest neighborhoods (near city center) happen to be in the top 20th percentile. While it is true that more supply slows down rent growth, it is possible that rents tend to grow slower in the city, as the market is reaching the sustainable price (as in, there’s only limited room for rent growth for the rental market to function). Changes in periphery areas might be higher than changes in city center areas (as price increases significantly). However, construction is still key here to rent growth, as zip-codes in the 60 – 80th percentile (some of which are also near city center and some even have higher rents than the city center) experienced higher rent growth, with less construction.
***
San Francisco
Similarly, for San Francisco, we first look at where construction has been concentrated.

Even adjusted for population, a majority of the new residential units have (and will) be concentrated in the Northeast area (SoMa, Inner Mission, and South Beach) since 2011. SoMa, specifically, experienced a spike (over 90 units per 1000 population level) in construction in 2016, followed by Inner Mission with 1183 units. We also noticed that much of the new residential inventory permissioned and constructed tend to be in the luxury range. The construction value of the projects (for multifamily buildings with 5+ units) are in the $150 – $350 thousand/unit range. This is somewhat expected as San Francisco is known for its skyrocketing rents.

In terms of the relationship between construction and rent growth, San Francisco in general has experienced a far stronger rent growth compared to San Jose — the rents went up over 40% in most neighborhoods between 2011 and 2016. Since San Francisco has less zip codes, instead of putting them into 5 buckets like what we did for San Jose, we divided them into 4 buckets. We found that between 2011 and 2016, zip-codes in the lowest 25th percentile of permits and construction experienced roughly an average of 8 percent higher than rent growth zip-codes in the top 20th percentile.

Similar to what’s mentioned in the San Jose section, in San Francisco, many of the most popular neighborhoods near city center are also in the top quadrant. While city center tends to have slower rent growth, construction is still key, as the third quadrant (which includes zip-code areas near city center) also experienced higher rent growth with less construction built between 2011 and 2016.
***
Construction is one of the key factors that affect rent growth in one area, as it indicates how much supply will be hitting the market. Indeed, the reasons behind the soaring rents in the Bay Area go far beyond construction (such as high-paying jobs created by the prosperous technology industry). However, our study of building permits issued by the City of San Jose and San Francisco does highlight the strong relationship between rent growth and construction, and where new construction will likely pop up in the coming couple of years.


