Cities across the United States combat rat infestations on a daily basis, with residents often running into the rodents on sidewalks, in parks, and, in extreme cases, inside their homes. Rats are not only a discomforting nuisance, but they can carry disease and damage property. City officials roll out new legislature and initiatives to help decrease the rat population in their respective cities, but rats continue to affect residents year after year. RentHop’s Rat Report of 2024 analyzes rodent complaint trends across the country – is your city rodent-infested?
RentHop Rat Report 2024
RentHop collects data from four major U.S. cities to help renters and homeowners understand the levels of rodent activity in their area, helping them decide where to live. This year, we analyzed 311 rodent complaints in Boston, Chicago, New York City, and Washington, D.C. The study analyzes data from 2015 through the end of September 2024 to answer the question: are rats running rampant in my neighborhood? It’s been two years since our last rat report, but the rats didn’t dissipate in our absence.
Rat complaints peaked in the four major cities between 2021 and 2022 during the post-pandemic rat explosion period. Since then, while rat complaints have slightly decreased, they remain high in all four cities. Complaints have increased in Boston so far, and the complaints could potentially increase in Washington D.C. this year. Complaints remain high in Chicago and New York City, but there are lower monthly sightings than throughout 2023, suggesting that the population will decrease by the end of this year.
Rodent Complaints by City
Figure 1 below highlights the total number of 311 rat complaints between 2015 and 2024 in Boston, Chicago, New York City, and Washington D.C. Year after year, Chicago has the largest number of rodent complaints of all the cities and has collected 36,134 complaints so far this year.
Chicago far outpaces the other four cities, but New York City comes in second with 23,60 rat complaints, followed by Washington D.C. with 13,367 rat complaints, then Boston with 3,936 rat complaints.
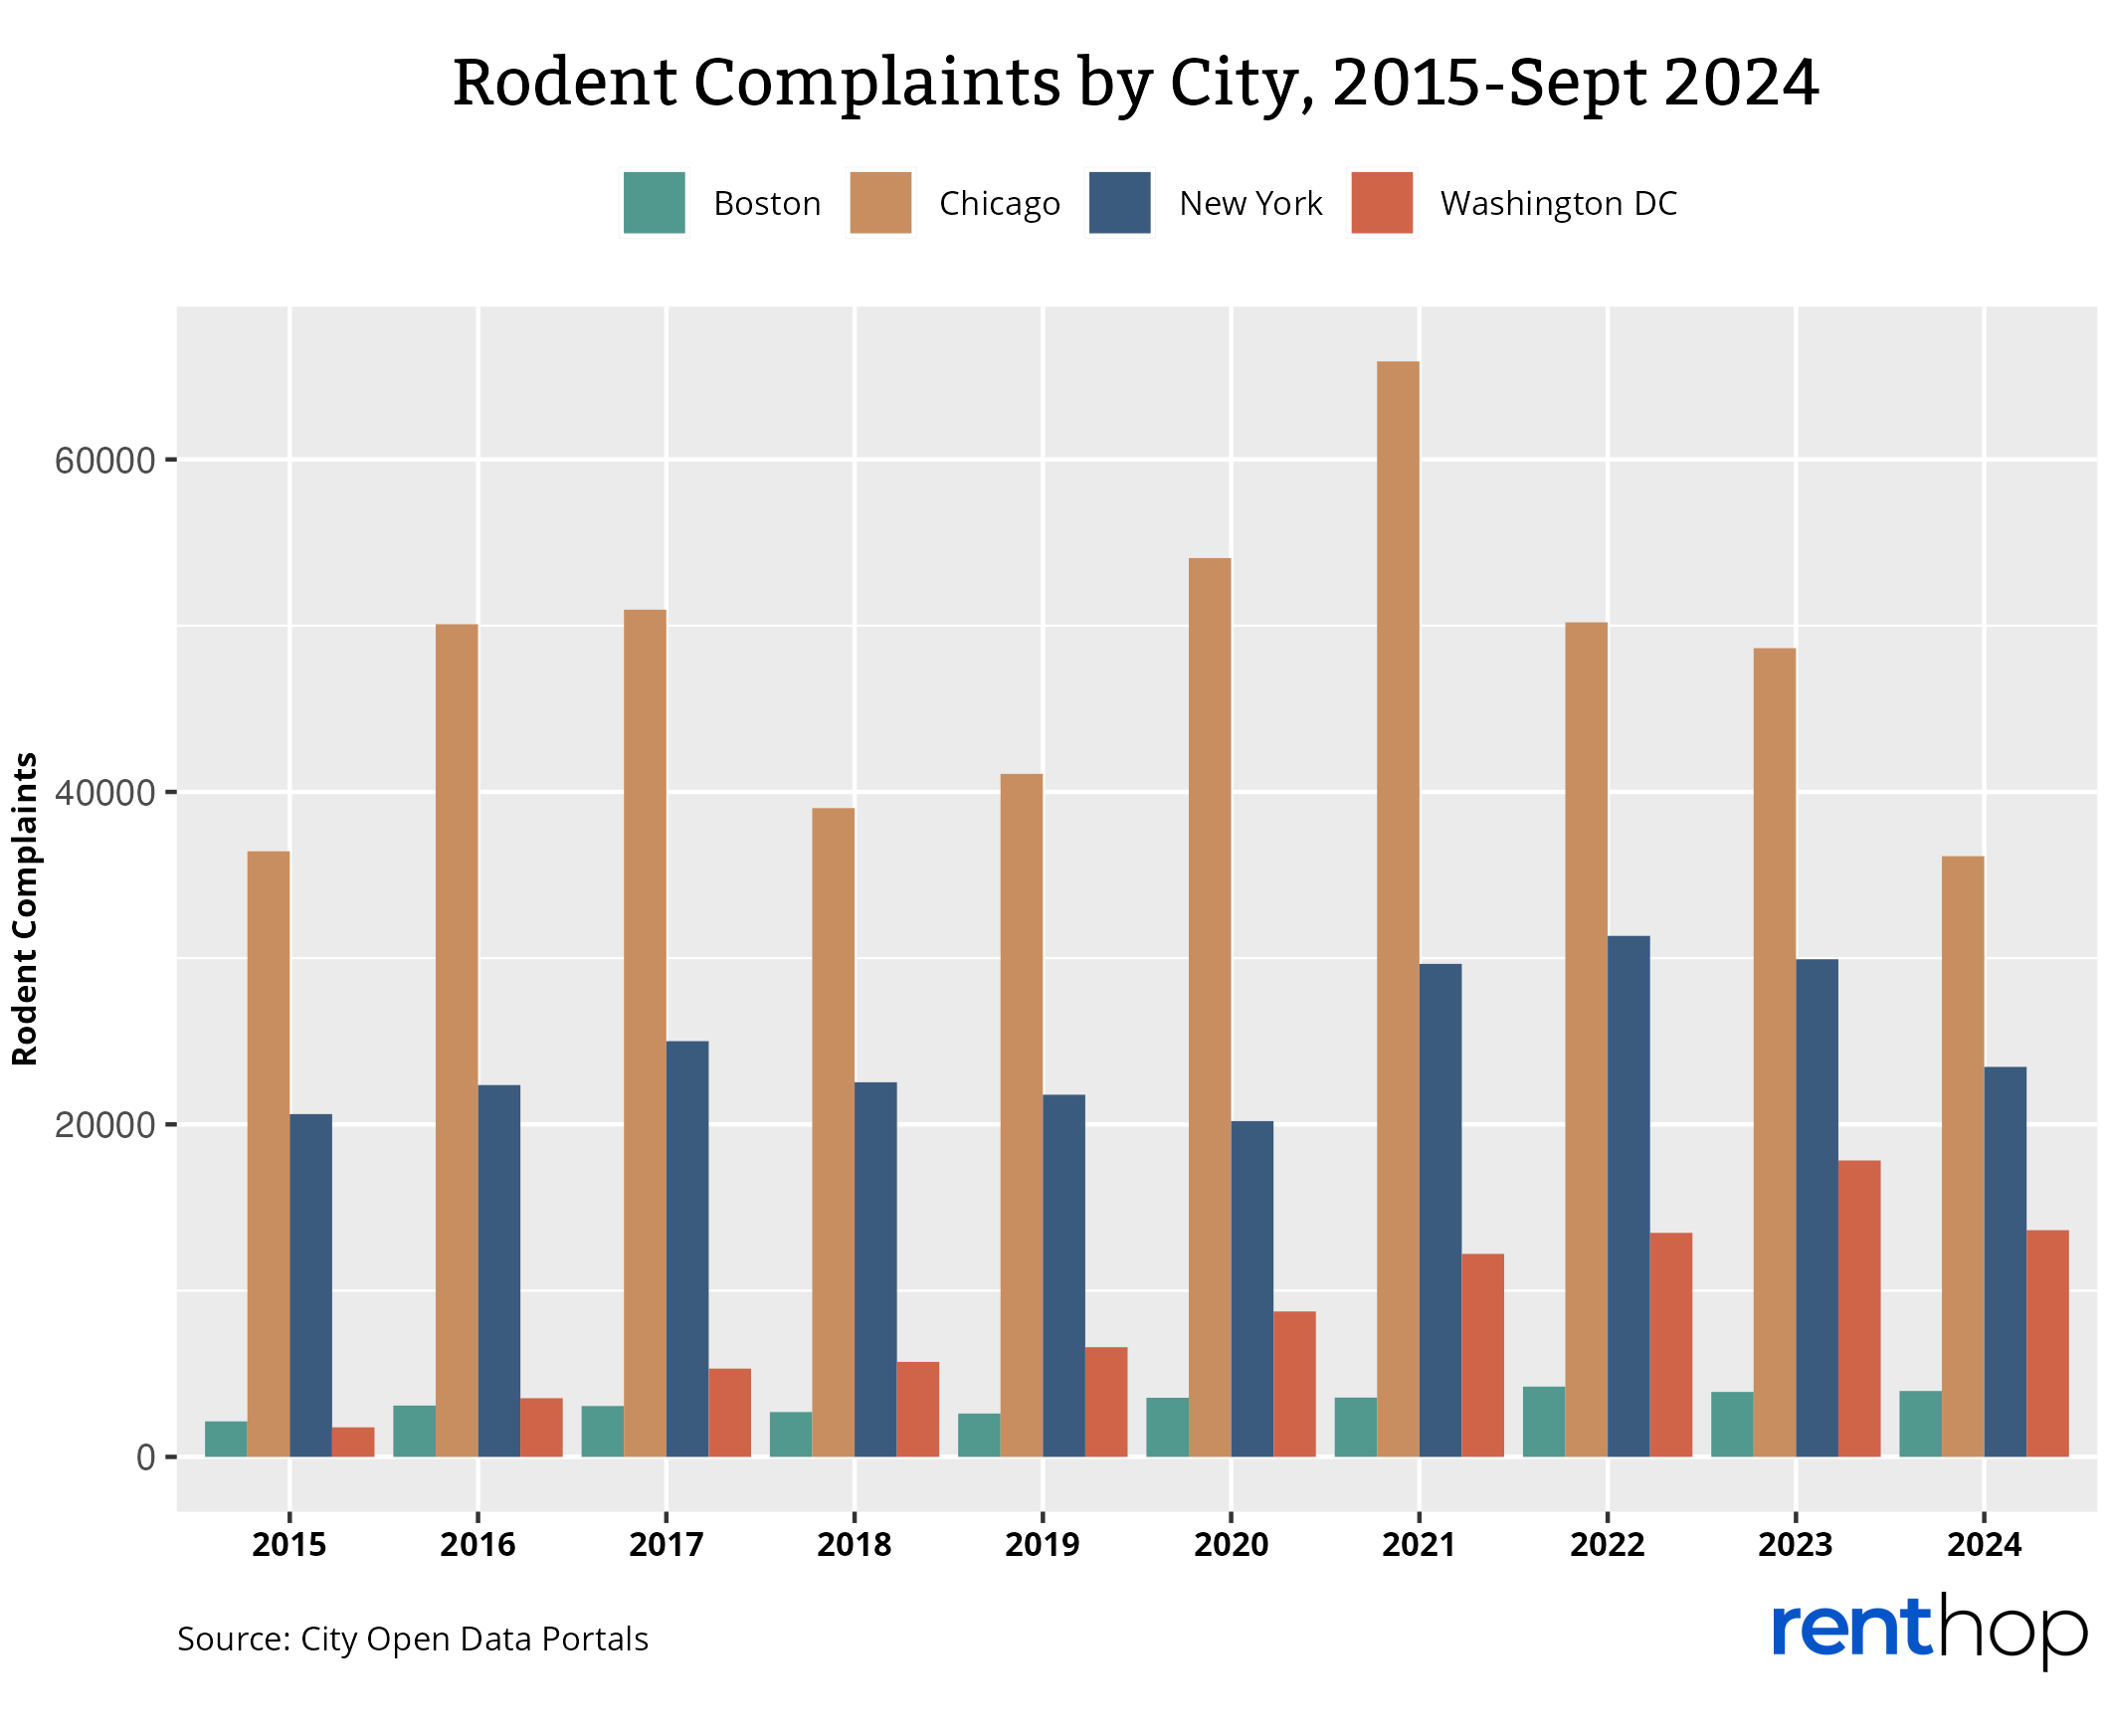
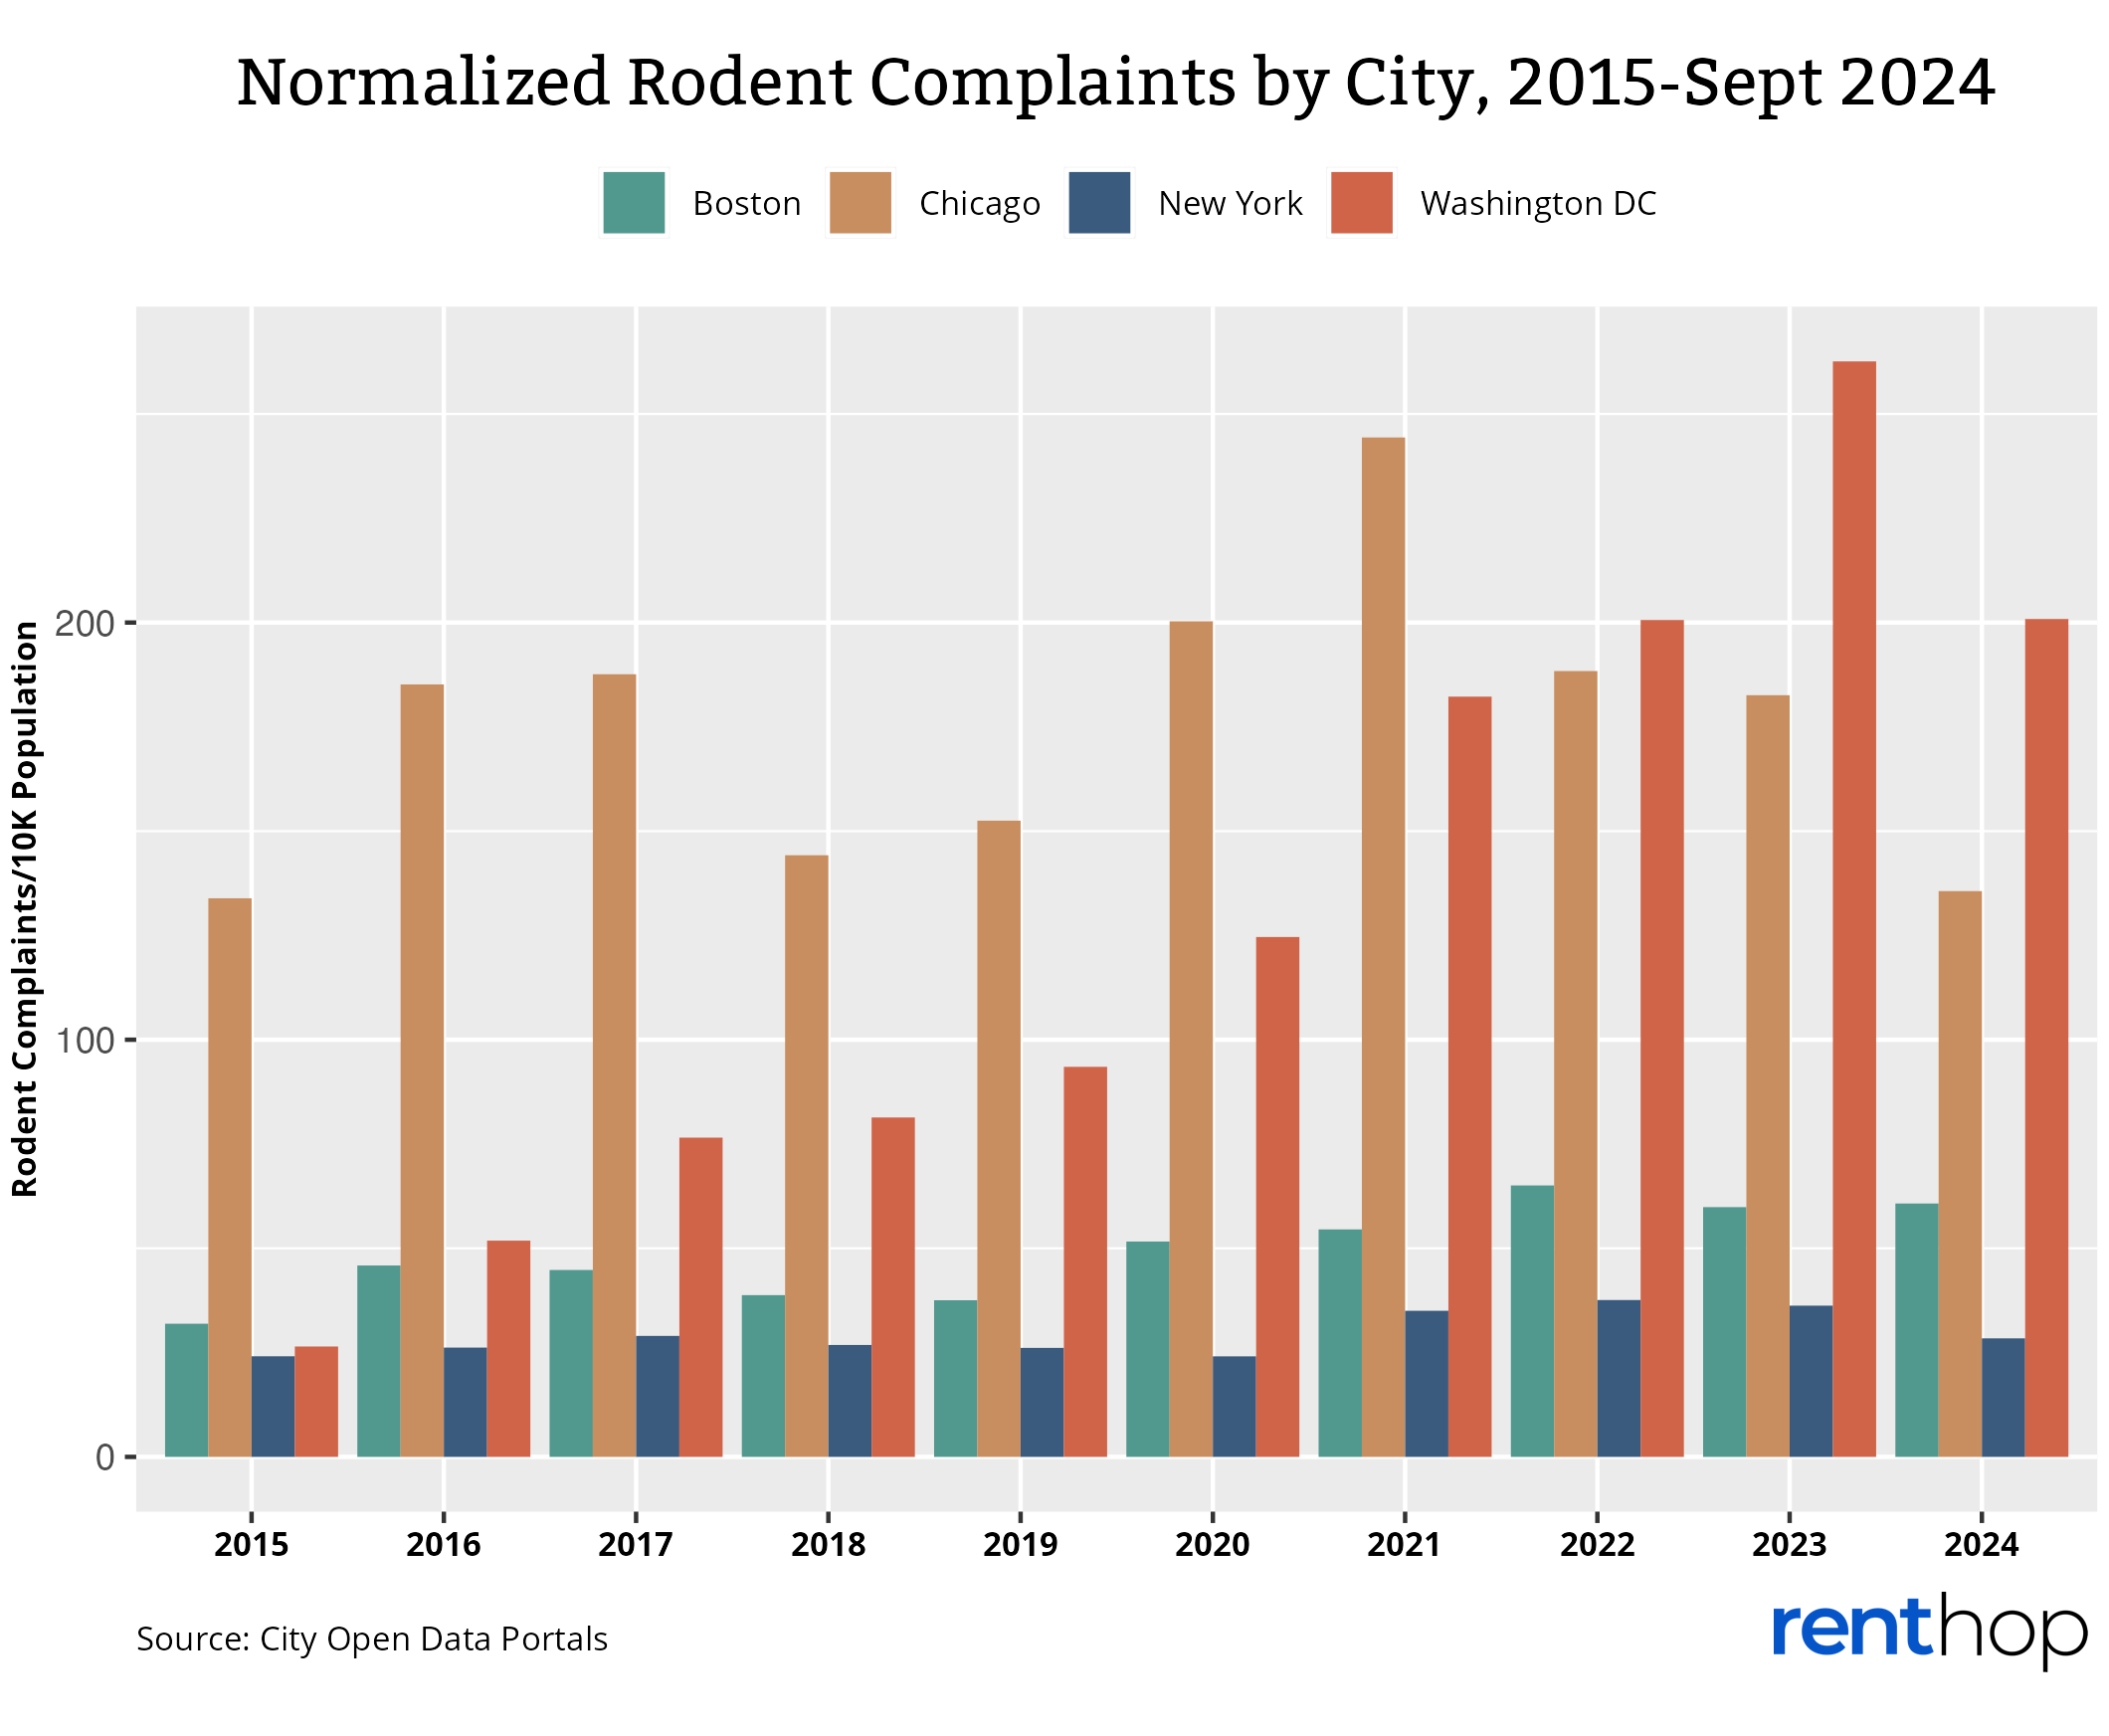
Figure 2 highlights the normalized number of rat complaints per city, measuring the complaints per 10,000 residents. Normalizing the data by population count allows us to fairly measure the rodent crisis in each city, as the size and density of the city could have a major impact on the number of complaints received. Once normalized, we found that, in fact, Washington D.C. is the most rat-infested city in the country, where there are 200.85 rodent complaints for every 10k residents. Residents in the city are more likely to encounter and report a rat than in the other rat-infested cities. Last year, the city surpassed all previous records for the concentration of rodent complaints (262.60 complaints/10k residents), and it could break the record yet again this year.
Chicago had the highest concentration of rat complaints in 2021 but has since fallen into second place. This year, the city has received 135.62 complaints per 10k residents. Boston falls next, with 60.74 complaints per 10k residents, followed by New York City. New York City has the lowest concentration of rat complaints, with only 28.41 complaints per 10k residents.
Select one of the cities below to learn more:
Boston: Consistent Rodent Population Sparks Outrage
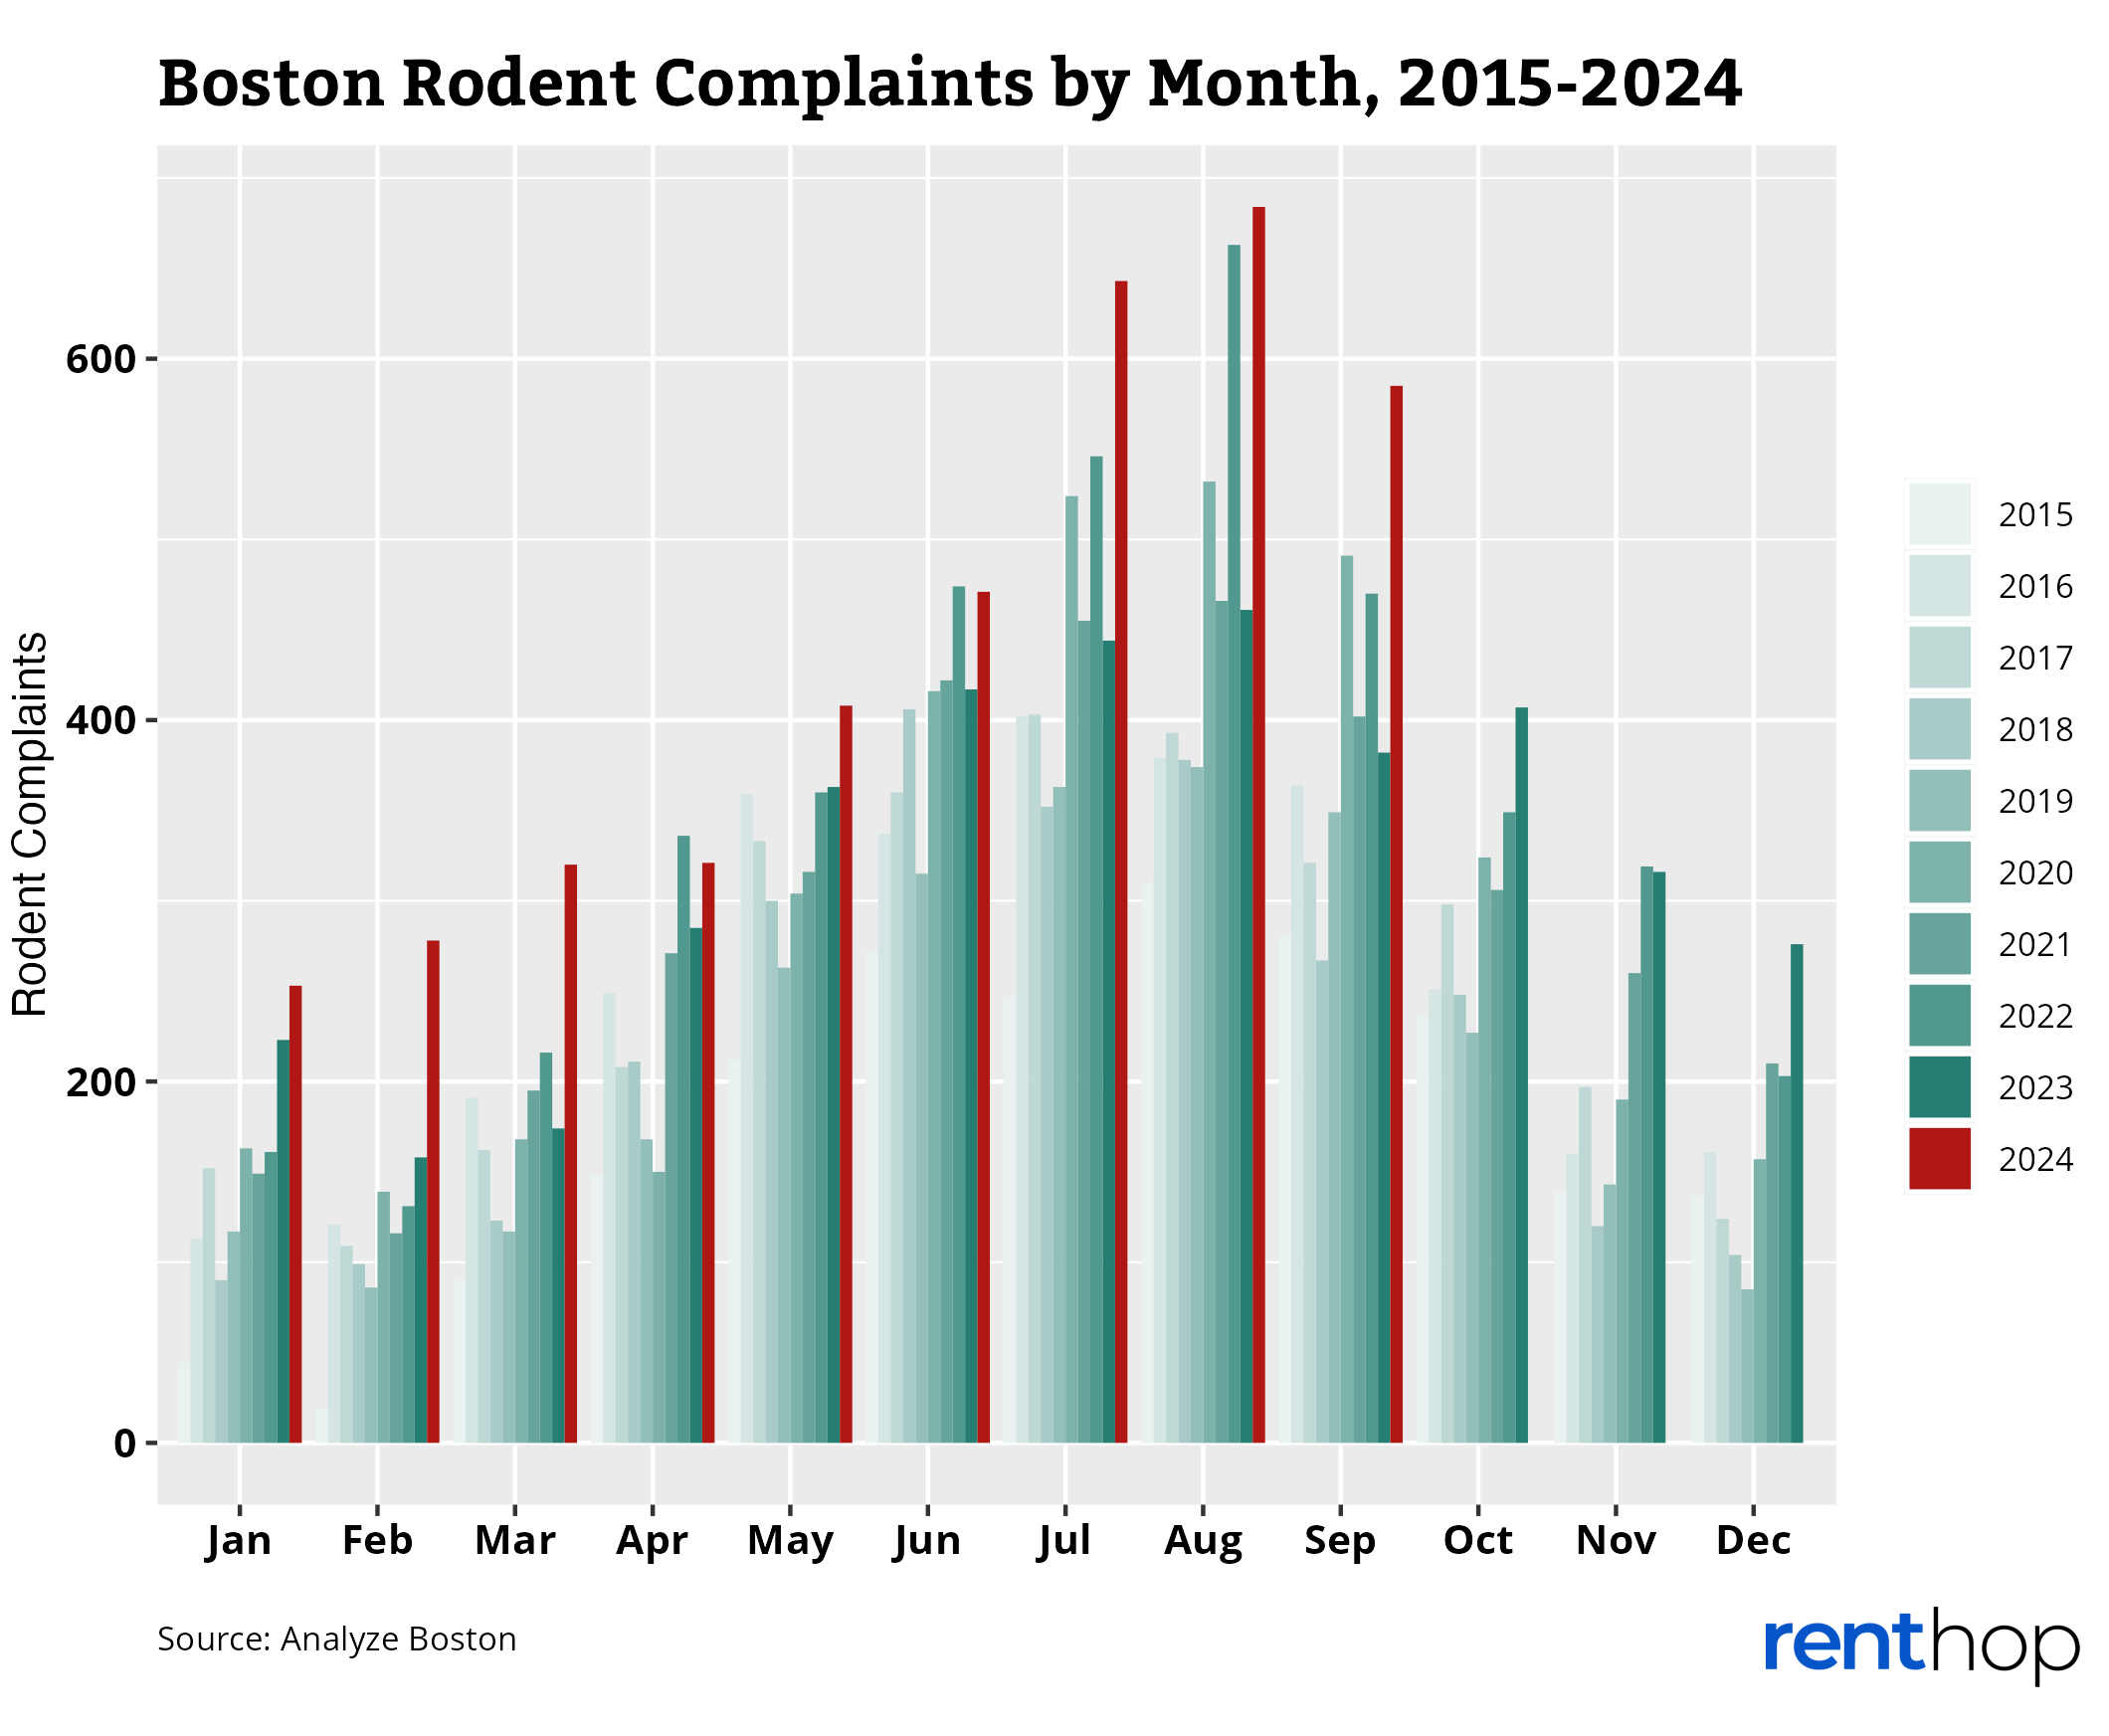
Rats are on the rise in Boston this year, with 311 complaints increasing across most neighborhoods. Compared to the other rat-infested cities, Boston has the third-highest concentration of rat complaints per 10,000 residents.
So far this year, the city has surpassed the number of rodent complaints from 2023. With another quarter remaining in the year, the city will likely surpass its record from 2022, resulting in the highest number of rodent complaints in the past decade.
After New York City appointed its first Rat Czar in 2023, Boston Mayor Michelle Wu plans to formalize a similar position for her city. The development could decrease rat complaints across the city and help curb the growing population.
Do Rodents Dominate Your Neighborhood?
With rats on the rise across the city, it’s important to note which areas have the highest concentration of 311 rodent complaints. Similar to most years, the city’s rat population lives at the center of the city, where the streets get narrower, and the trash piles up. One of the city’s largest challenges remains its aging infrastructure, with an old sewage system that makes an ideal breeding ground for rodents.
The interactive map below indicates the concentration of 311 rat/rodent sighting complaints in Boston. Neighborhoods in darker shades have a higher concentration of complaints in 2024. Larger neighborhoods may receive more complaints than smaller neighborhoods, so we normalized the number of rodent complaints by population (10,000 residents). You can click on the polygons to learn more about each neighborhood.
The North End became the city’s most rat-infested neighborhood in 2024, receiving 132.35 complaints per 10,000 residents. Last year, the neighborhood received 79 rodent complaints, but that jumped 81% this year to 143 complaints. The area’s residents are speaking up about the matter, with one using a Bruins hockey stick to swat rats away during the daytime.
The South End follows the North in rodent complaints, with 108.72 complaints per 10k residents. This neighborhood also witnessed an increase in complaints year over year and has already surpassed its record for the total number of yearly complaints.
Rodent complaints only decreased in two neighborhoods across the city this year. As rats continue to wreak havoc across most areas, the city must find a way to control their growing population.
Boston Neighborhoods with the Most Rodent Complaints in 2024:
- North End – 143 complaints in 2024, 132.35 complaints/10k population
- South End – 336 complaints in 2024, 108.72 complaints/10k population
- Back Bay – 196 complaints in 2024, 107.75 complaints/10k population
- Allston – 266 complaints in 2024, 106.81 complaints/10k population
- Beacon Hill – 77 complaints in 2024, 82.48 complaints/10k population
Rat Complaints Increased the Most Here:
- West End – 1 complaint in 2023, 8 in 2024 (+700%)
- Chinatown – 4 complaints in 2023, 12 in 2024 (+200%)
- Roslindale – 47 complaints in 2023, 137 in 2024 (+191.49%)
- Jamaica Plain – 132 complaints in 2023, 279 in 2024 (+111.36%)
- Longwood – 1 complaint in 2023, 2 in 2024 (+100%)
These Neighborhoods Saw the Sharpest Decline in Complaints:
- Beacon Hill – 159 complaints in 2023, 77 in 2024 (-51.57%)
- South Boston Waterfront – 15 complaints in 2023, 13 in 2024 (-13.33%)
Residents Complain about Rats Most Often as These Boston Addresses:
- 431 Shawmut Ave, 02118 – 15 rodent complaints
- 71 Orchardhill Rd, 02130 – 13 rodent complaints
- 284 Commonwealth Ave, 02115 – 12 rodent complaints
- 14 Clive St, 02130 – 12 rodent complaints
- 332 Chestnut Hill Ave, 02135 – 11 rodent complaints
Chicago: Highest Volume of Rats
Year after year, Chicago has the highest total number of rat complaints out of any rodent-ridden city in the Northeast. So far, in 2024, residents have submitted 36,134 rodent complaints to 311. The city has the second-highest concentration of complaints, with 135.62 complaints/10,000 population.
While the city has one of the highest populations of rats, it’s important to note that complaints have continued to decrease since their 2021 record of 65,897. Each year since, fewer residents have filed complaints about rats, and it looks like 2024 will end the year with fewer complaints than 2023. The city uses containerization to decrease its population by providing free plastic carts with tight-fitting lids to collect trash, limiting the amount of food rats can access.
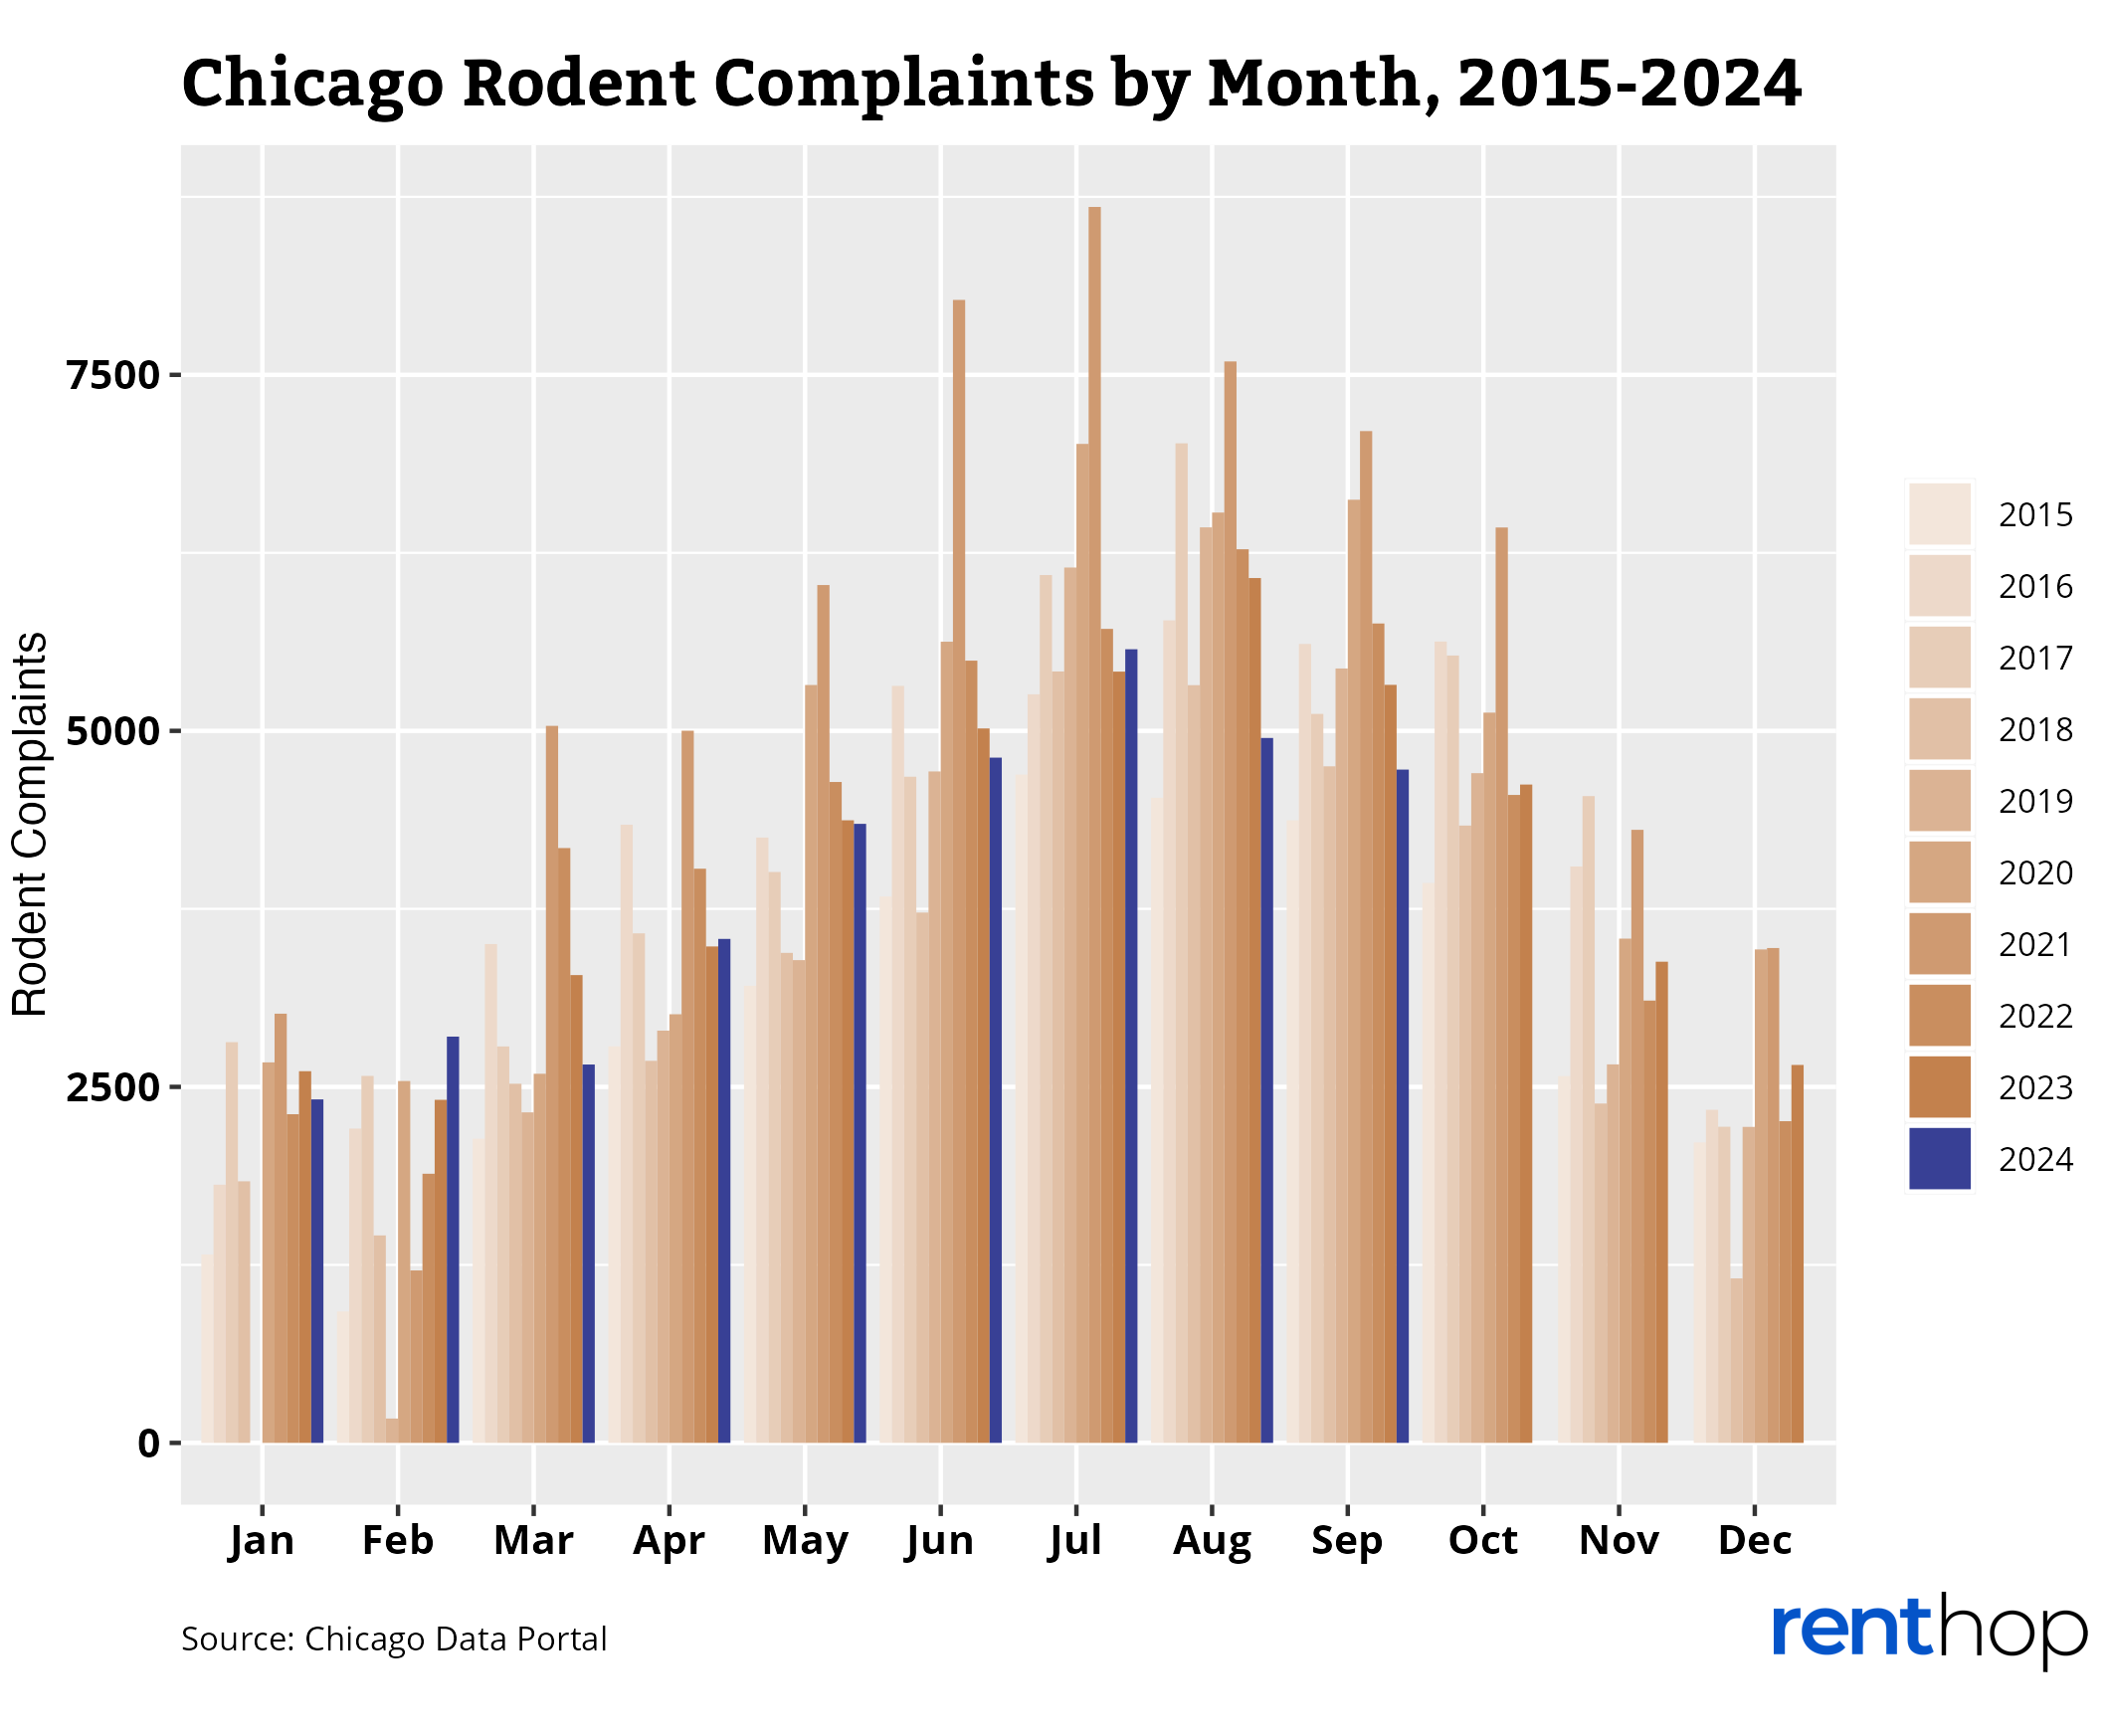
Summer remains the busiest time of year for rats, when they reproduce and have more access to food and water. This year, July remained the city’s most active month for rodent complaints, with 5,573 reports. That’s 179 daily complaints.
Do Rodents Run Amuck in Your Neighborhood?
The interactive map below indicates the concentration of 311 rat/rodent sighting complaints in Chicago. Neighborhoods in darker shades have a higher concentration of complaints in 2024. Larger neighborhoods may receive more complaints than smaller neighborhoods, so we normalized the number of rodent complaints by population (10,000 residents). You can click on the polygons to learn more about each neighborhood.
Clearing is the most rat-infested neighborhood in the city, with 1,539 complaints so far this year, or 622.37 complaints per 10k residents. The neighborhood resides near Midway Airport, which also has a high concentration of restaurants. Since last year, rat complaints increased 18.02% in this neighborhood.
Chicago Neighborhoods with the Most Rodent Complaints in 2024:
- Clearing – 1,539 complaints in 2024, 622.37 complaints/10k population
- Fuller Park – 110 complaints in 2024, 492.61 complaints/10k population
- Garfield Ridge – 1,473 complaints in 2024, 404.66 complaints/10k population
- West Englewood – 736 complaints in 2024, 285.58 complaints/10k population
- Jefferson Park – 702 complaints in 2024, 259.69 complaints/10k population
Rat Complaints Increased the Most Here:
- O’Hare – 10 complaints in 2023, 22 in 2024 (+120%)
- Gage Park – 285 complaints in 2023, 558 in 2024 (+95.79%)
- Beverly – 155 complaints in 2023, 298 in 2024 (+92.26%)
- Pullman – 41 complaints in 2023, 69 in 2024 (+68.29%)
- Oakland – 40 complaint in 2023, 66 in 2024 (+65%)
These Neighborhoods Saw the Sharpest Decline in Complaints:
- Burnside – 19 complaints in 2023, 8 in 2024 (-57.89%)
- Near South Side – 116 complaints in 2023, 55 in 2024 (-52.59%)
- Edison Park – 275 complaints in 2023, 155 in 2024 (-43.64%)
- Near North Side – 607 complaints in 2023, 365 in 2024 (-39.87%)
- Near West Side – 733 complaints in 2023, 461 in 2024 (-37.11%)
Residents Complain about Rats Most Often as These Chicago Addresses:
- 345 W 42nd Pl, 60609 – 38 rodent complaints
- 2853 W Farragut Ave, 60625 – 22 rodent complaints
- 4254 N Kimball Ave, 60618 – 19 rodent complaints
- 458 W Briar Pl, 60657 – 19 rodent complaints
- 3637 N Artesian Ave, 66018 – 18 rodent complaints
New York City: Did the Rat Czar Help?
The pandemic drastically affected the rodent population across New York City. When rat complaints decreased in 2020, they returned stronger than ever in 2021 and continue to wreak havoc across all five boroughs.
While the city’s infamous mayor has questionable policies, one of the few publicly celebrated achievements during his administration has been the initiation of the city’s first Rat Czar in 2023. Kathleen Corradi’s salaried position involves decreasing the rodent population across the city, focusing on high-traffic areas like Harlem.
Rat complaints increased in some neighborhoods this year, but rat sightings are overall lower in 2024, meaning the Rat Czar completed a successful first year of reign. Compared to the three other major rat-infested cities, New York City has the fewest 311 rat complaints per 10,000 residents.
Brooklyn Becomes the Most Rat-Infested Borough in New York City
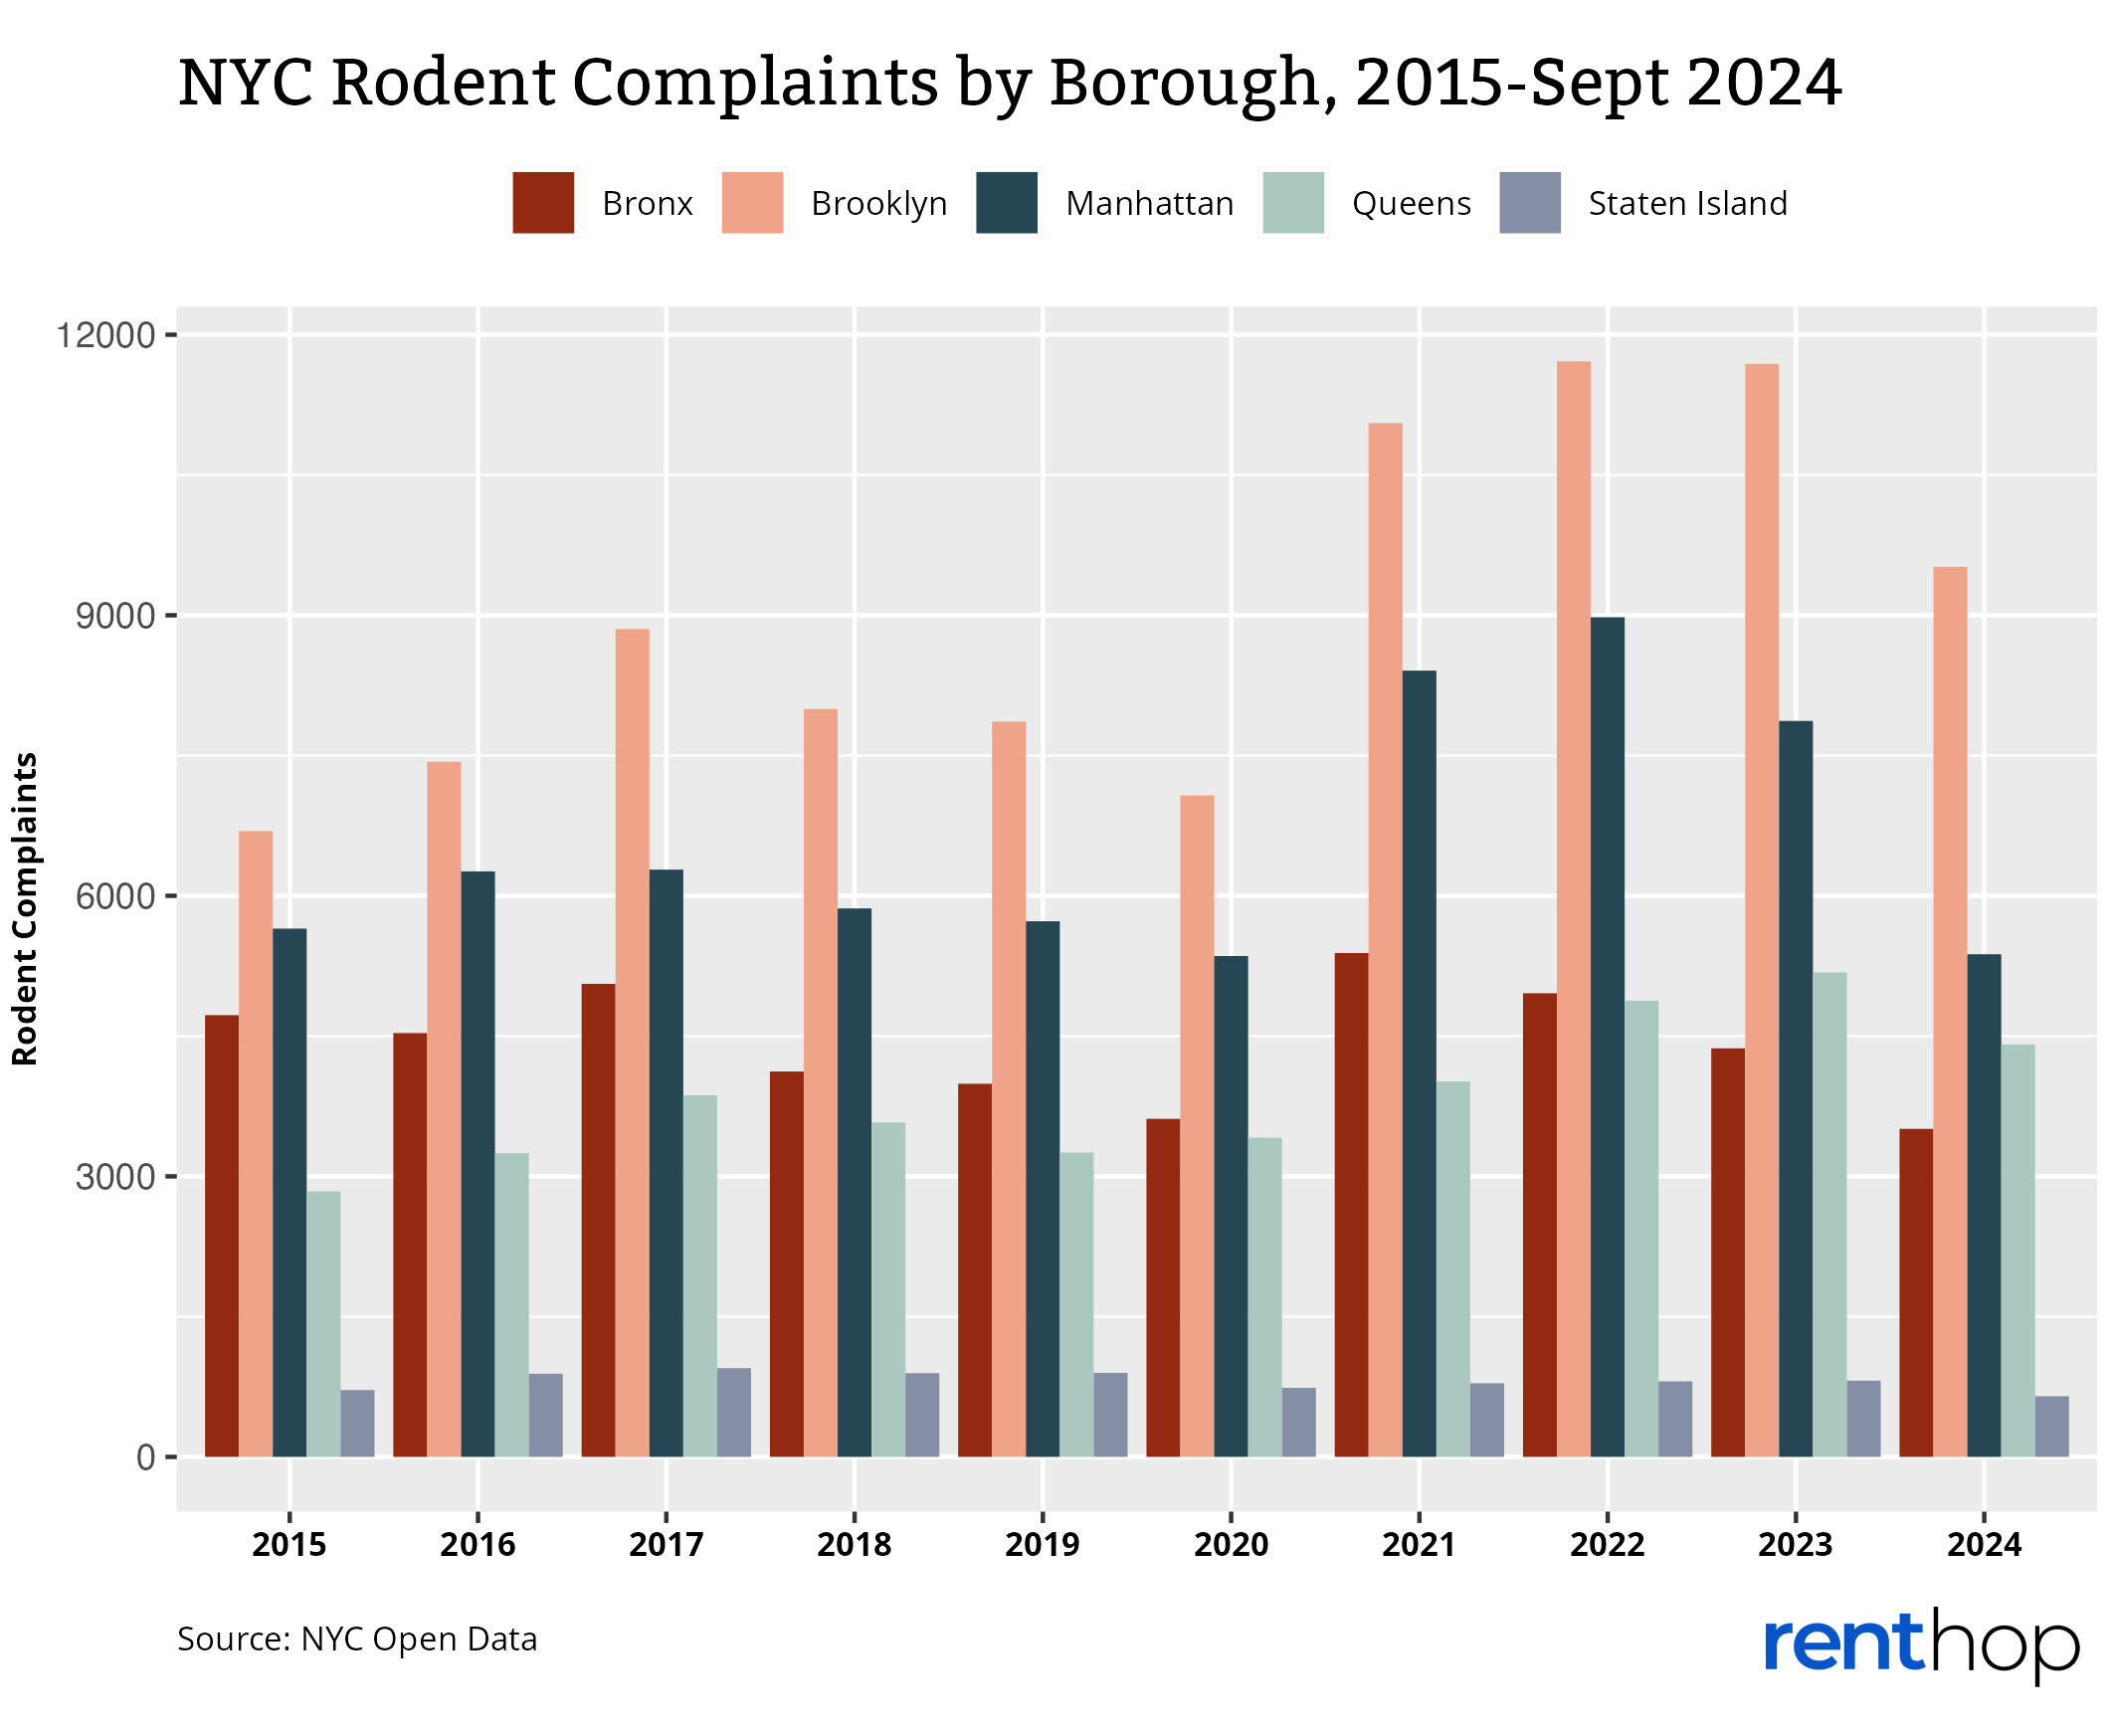
Since New York City consists of five boroughs with their neighborhoods, we first analyzed the number of rodent complaints by borough. Figure 5 below indicates how the numbers have changed by year and by borough since 2015. This year, complaints remain slightly lower in each neighborhood but will likely outpace last year’s data by the end of December.
Brooklyn, New York City
Brooklyn has the highest concentration of rats per resident out of all the city’s boroughs and the highest number of complaints overall. This year, so far, the borough has received 9,518 complaints. While this is lower than 11,689 complaints in 2023, this year’s complaints may hit or surpass last year’s numbers. Additionally, three of the city’s most active spots for rodent sightings reside in Brooklyn.
Brooklyn rat complaints drastically increased between 2020 and 2021, when more residents returned to the city after the pandemic, increasing food waste, trash, and bait for rats. Since this population growth, rodent sightings remain high across the borough.
The Bronx, New York City
Rodent complaints in the Bronx continue to decrease year over year after the peak of 5,388 complaints in 2021. This year so far, the borough has received 3,508 complaints, compared to 4,369 last year. The borough will likely hit 4,000 complaints by the end of the year.
Residents can breathe a sigh of relief as rat sightings decrease across the borough year after year.
Manhattan, New York City
Manhattan remains a hot spot for rodent activity but no longer hosts the highest concentration of sightings. Residents have complained about rats 5,375 times so far this year.
The borough reached its peak number of rat sightings in 2022, with 8,979 complaints. Complaints decreased by 12.35% between 2022 and 2023, with only 7,870 complaints last year. With the city’s strong focus on decreasing rat activity, it’s possible that Manhattan will have fewer complaints this year.
Queens, New York City
Rats also enjoy their homes in Queens, with a population that grows year over year. So far, in 2024, the borough has witnessed 4,409 complaints. While the neighborhood could surpass last year’s record number of complaints (5,181), it could fall a bit shorter, looking more like the total number from 2022.
Staten Island, New York City
Rodents also increased across Staten Island between 2022 and 2023, showcasing the city-wide trend of more rat sightings during this period. In 2024, residents have reported rats 649 times, and the borough could surpass last year’s record of 815 complaints.
NYC’s Rat Girl Summer
Figure 6 below breaks down rodent complaints by month from 2015 to 2024. Some months this year recorded a higher number of rat complaints than in 2023. However, monthly rodent complaints only broke one monthly record this year (September with 2,998 complaints), suggesting rodent complaints are decreasing city-wide.
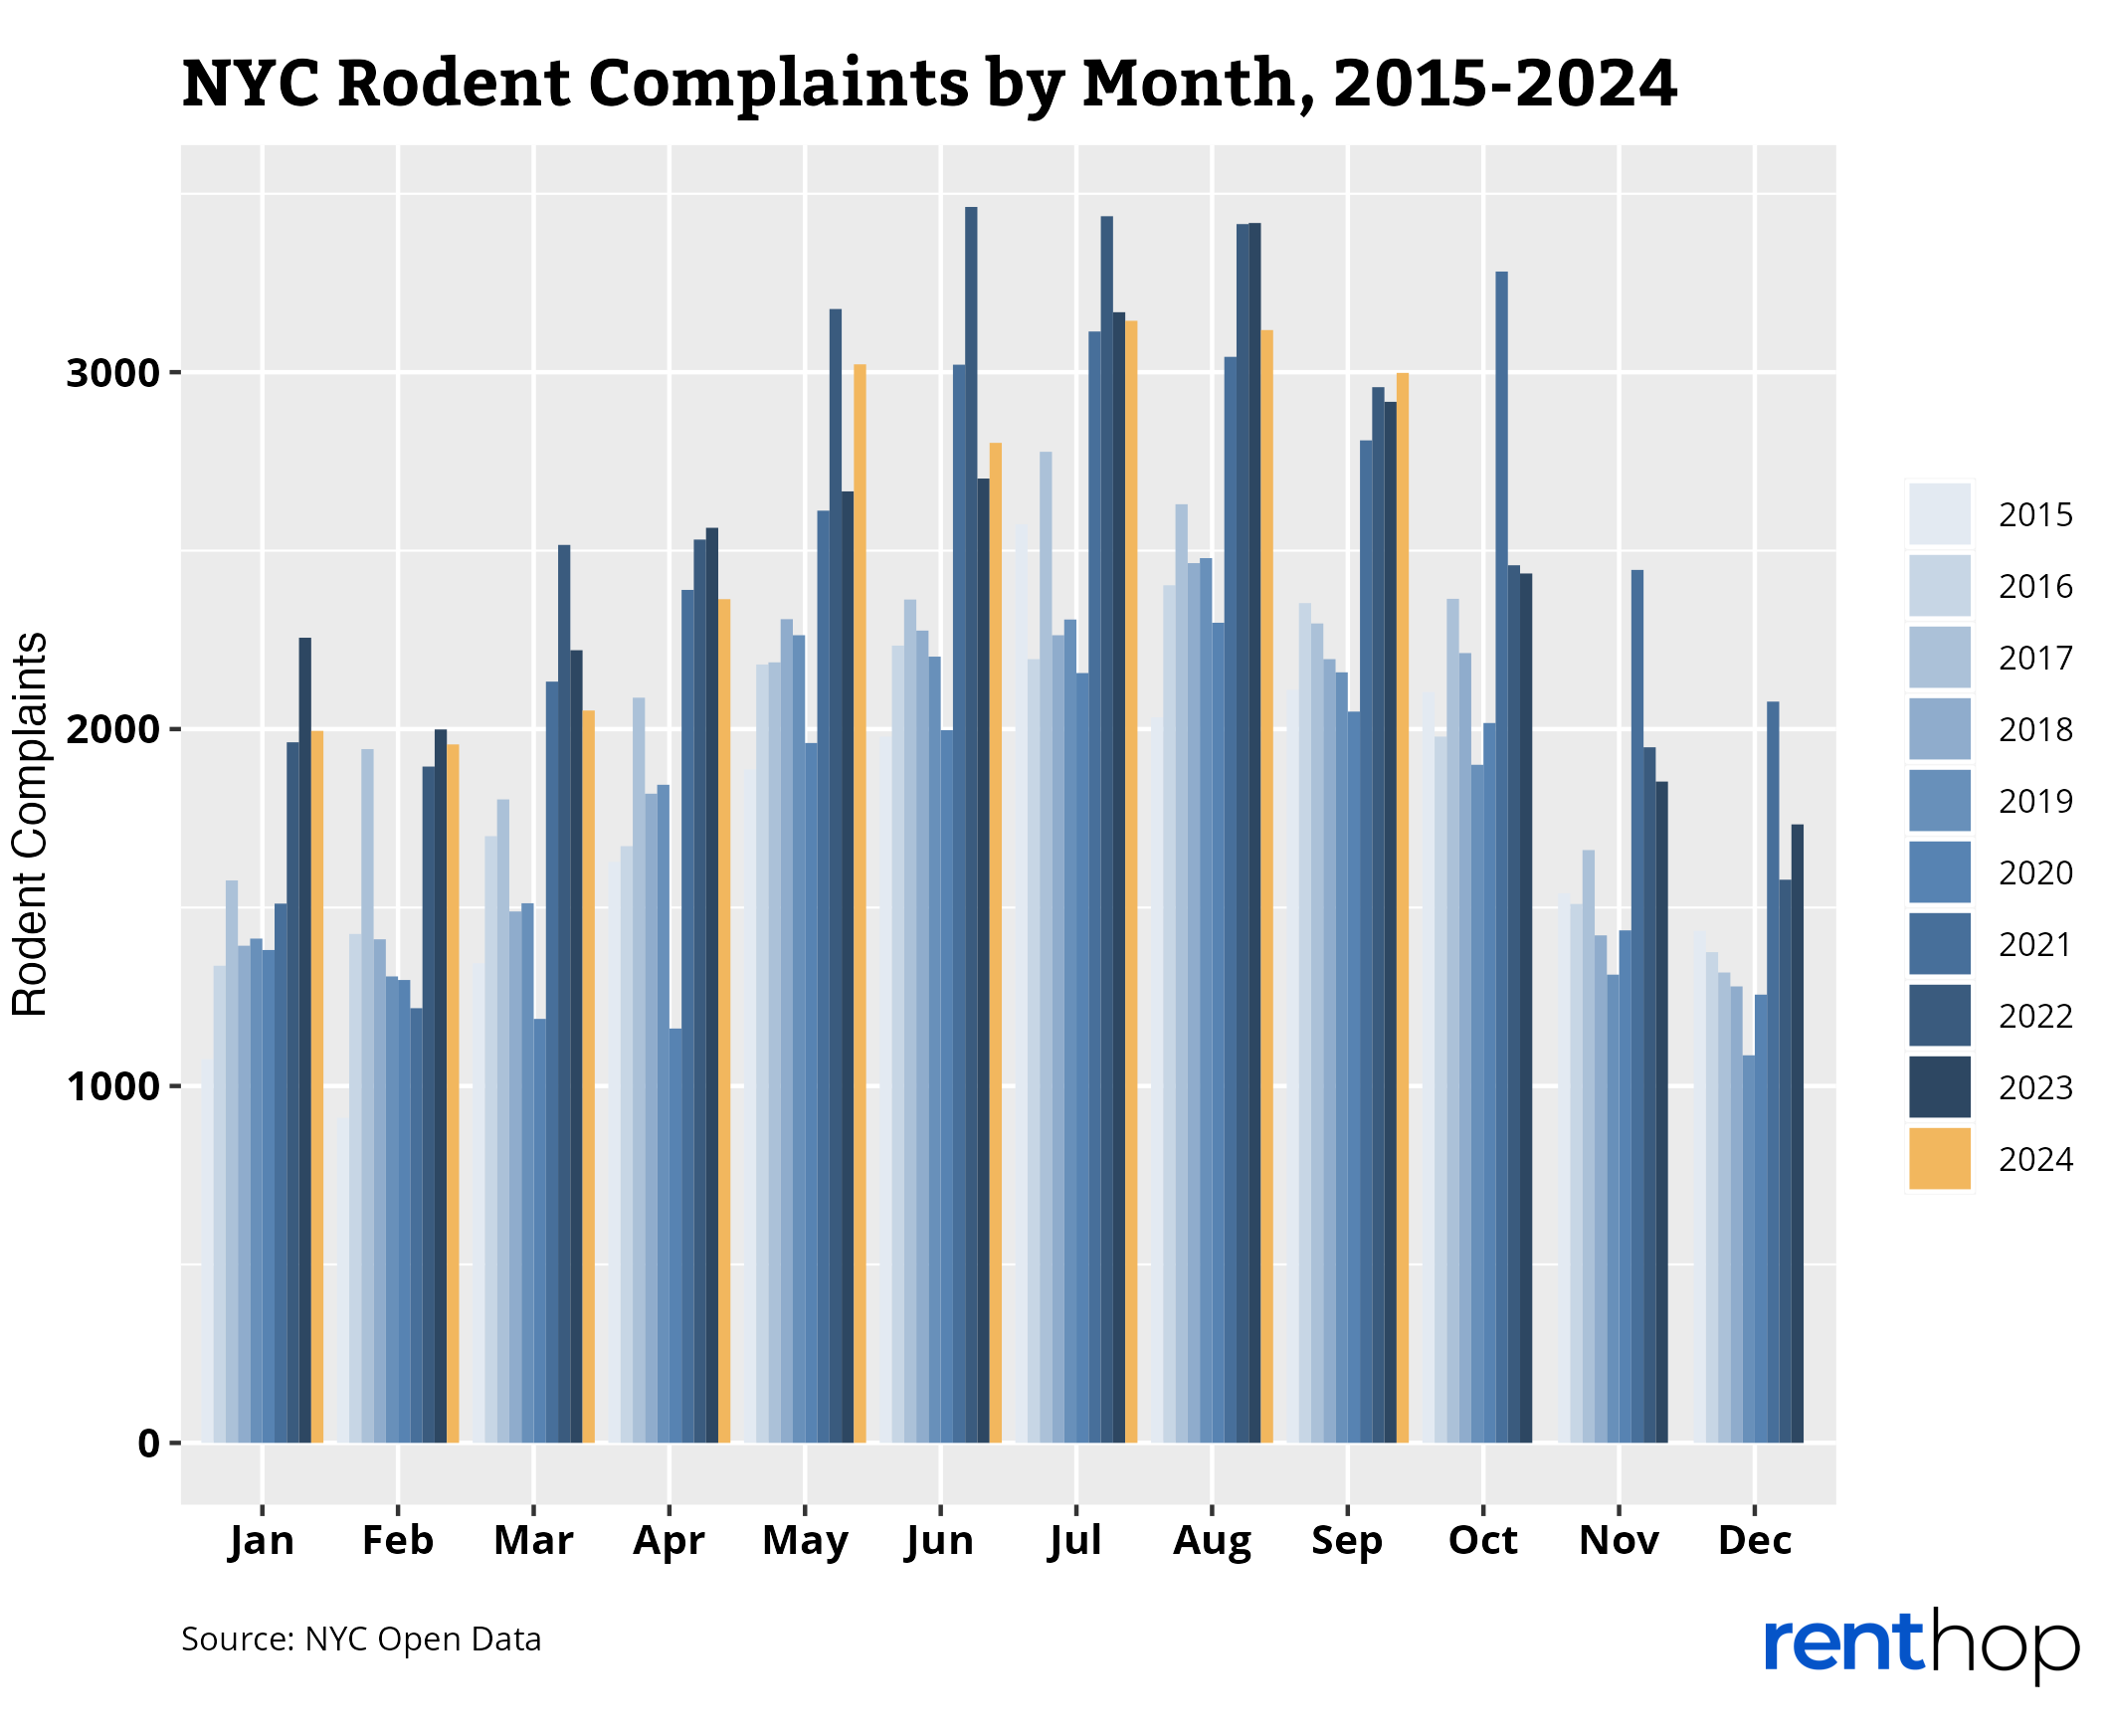
Rat sightings in New York City drastically increase throughout the summer months, when hot trash sits on the sidewalks for hours, inviting large quantities of rodents. Rodent activity peaked this year in July, with 3,144 complaints to 311, a 0.75% increase from July 2023.
Do Rats Rule Your Neighborhood?
The interactive map below indicates the concentration of 311 rat/rodent sighting complaints in New York City. Neighborhoods in darker shades have a higher concentration of complaints in 2024. Larger neighborhoods may receive more complaints than smaller neighborhoods, so we normalized the number of rodent complaints by population (10,000 residents). You can click on the polygons to learn more about each neighborhood.
New York City Neighborhoods with the Most Rodent Complaints in 2024:
- Harlem (South) – 442 complaints in 2024, 93.82 complaints/10k population
- Ridgewood – 500 complaints in 2024, 75.2 complaints/10k population
- Windsor Terrace-South Slope – 174 complaints in 2024, 73.66 complaints/10k population
- Bushwick (West) – 425 complaints in 2024, 72.41 complaints/10k population
- Clinton Hill – 204 complaints in 2024, 71.21 complaints/10k population
Rat Complaints Increased the Most Here:
- Kew Gardens Hills – 33 complaints in 2023, 184 in 2024 (+457.60%)
- Fort Hamilton – 1 complaints in 2023, 3 in 2024 (+200%)
- Glen Oaks-Floral Park-New Hyde Park – 7 complaints in 2023, 21 in 2024 (+200%)
- Parkchester – 13 complaints in 2023, 35 in 2024 (+169.20%)
- Tompkinsville-Stapleton-Clifton-Fox Hills – 15 complaint in 2023, 34 in 2024 (+126.70%)
These Neighborhoods Saw the Sharpest Decline in Complaints:
- Co-op City – 7 complaints in 2023, 1 in 2024 (-85.70%)
- Midtown-Times Square – 129 complaints in 2023, 25 in 2024 (-80.60%)
- Kew Gardens – 32 complaints in 2023, 10 in 2024 (-68.80%)
- Whitestone-Beechhurst – 66 complaints in 2023, 26 in 2024 (-60.60%)
- Flatlands – 130 complaints in 2023, 52 in 2024 (-60%)
Residents Complain about Rats Most Often as These NYC Addresses:
- 1000 5th Ave, 10028 (The Metropolitan Museum of Art) – 75 rodent complaints
- 2683 Morris Ave, 10468 – 50 rodent complaints
- Owl’s Head Park, 11220 – 49 rodent complaints
- 55 East 21st St, 11226 – 34 rodent complaints
- 3120 Brighton Fifth St, 112135 – 33 rodent complaints
Washington D.C.: Rat Capital of the United States
Washington, D.C., has a significant rat problem. While it has a lower total number of complaints than the three other rat-infested cities, it has the highest concentration of 311 complaints of any city, with 200.85 complaints per 10,000 residents. Similar to Chicago and New York City, the rat population exploded between 2020 and 2021, and the city has been unable to control it since.
13,637 residents have filed rat complaints this year, and the city may close 2024 with fewer complaints than in 2023. Rats complaints skyrocketed in the early winter months this year, surpassing decade-long records in February and March. Afterward, complaints remained lower than in 2023, and July received the highest number of complaints: 1,753.
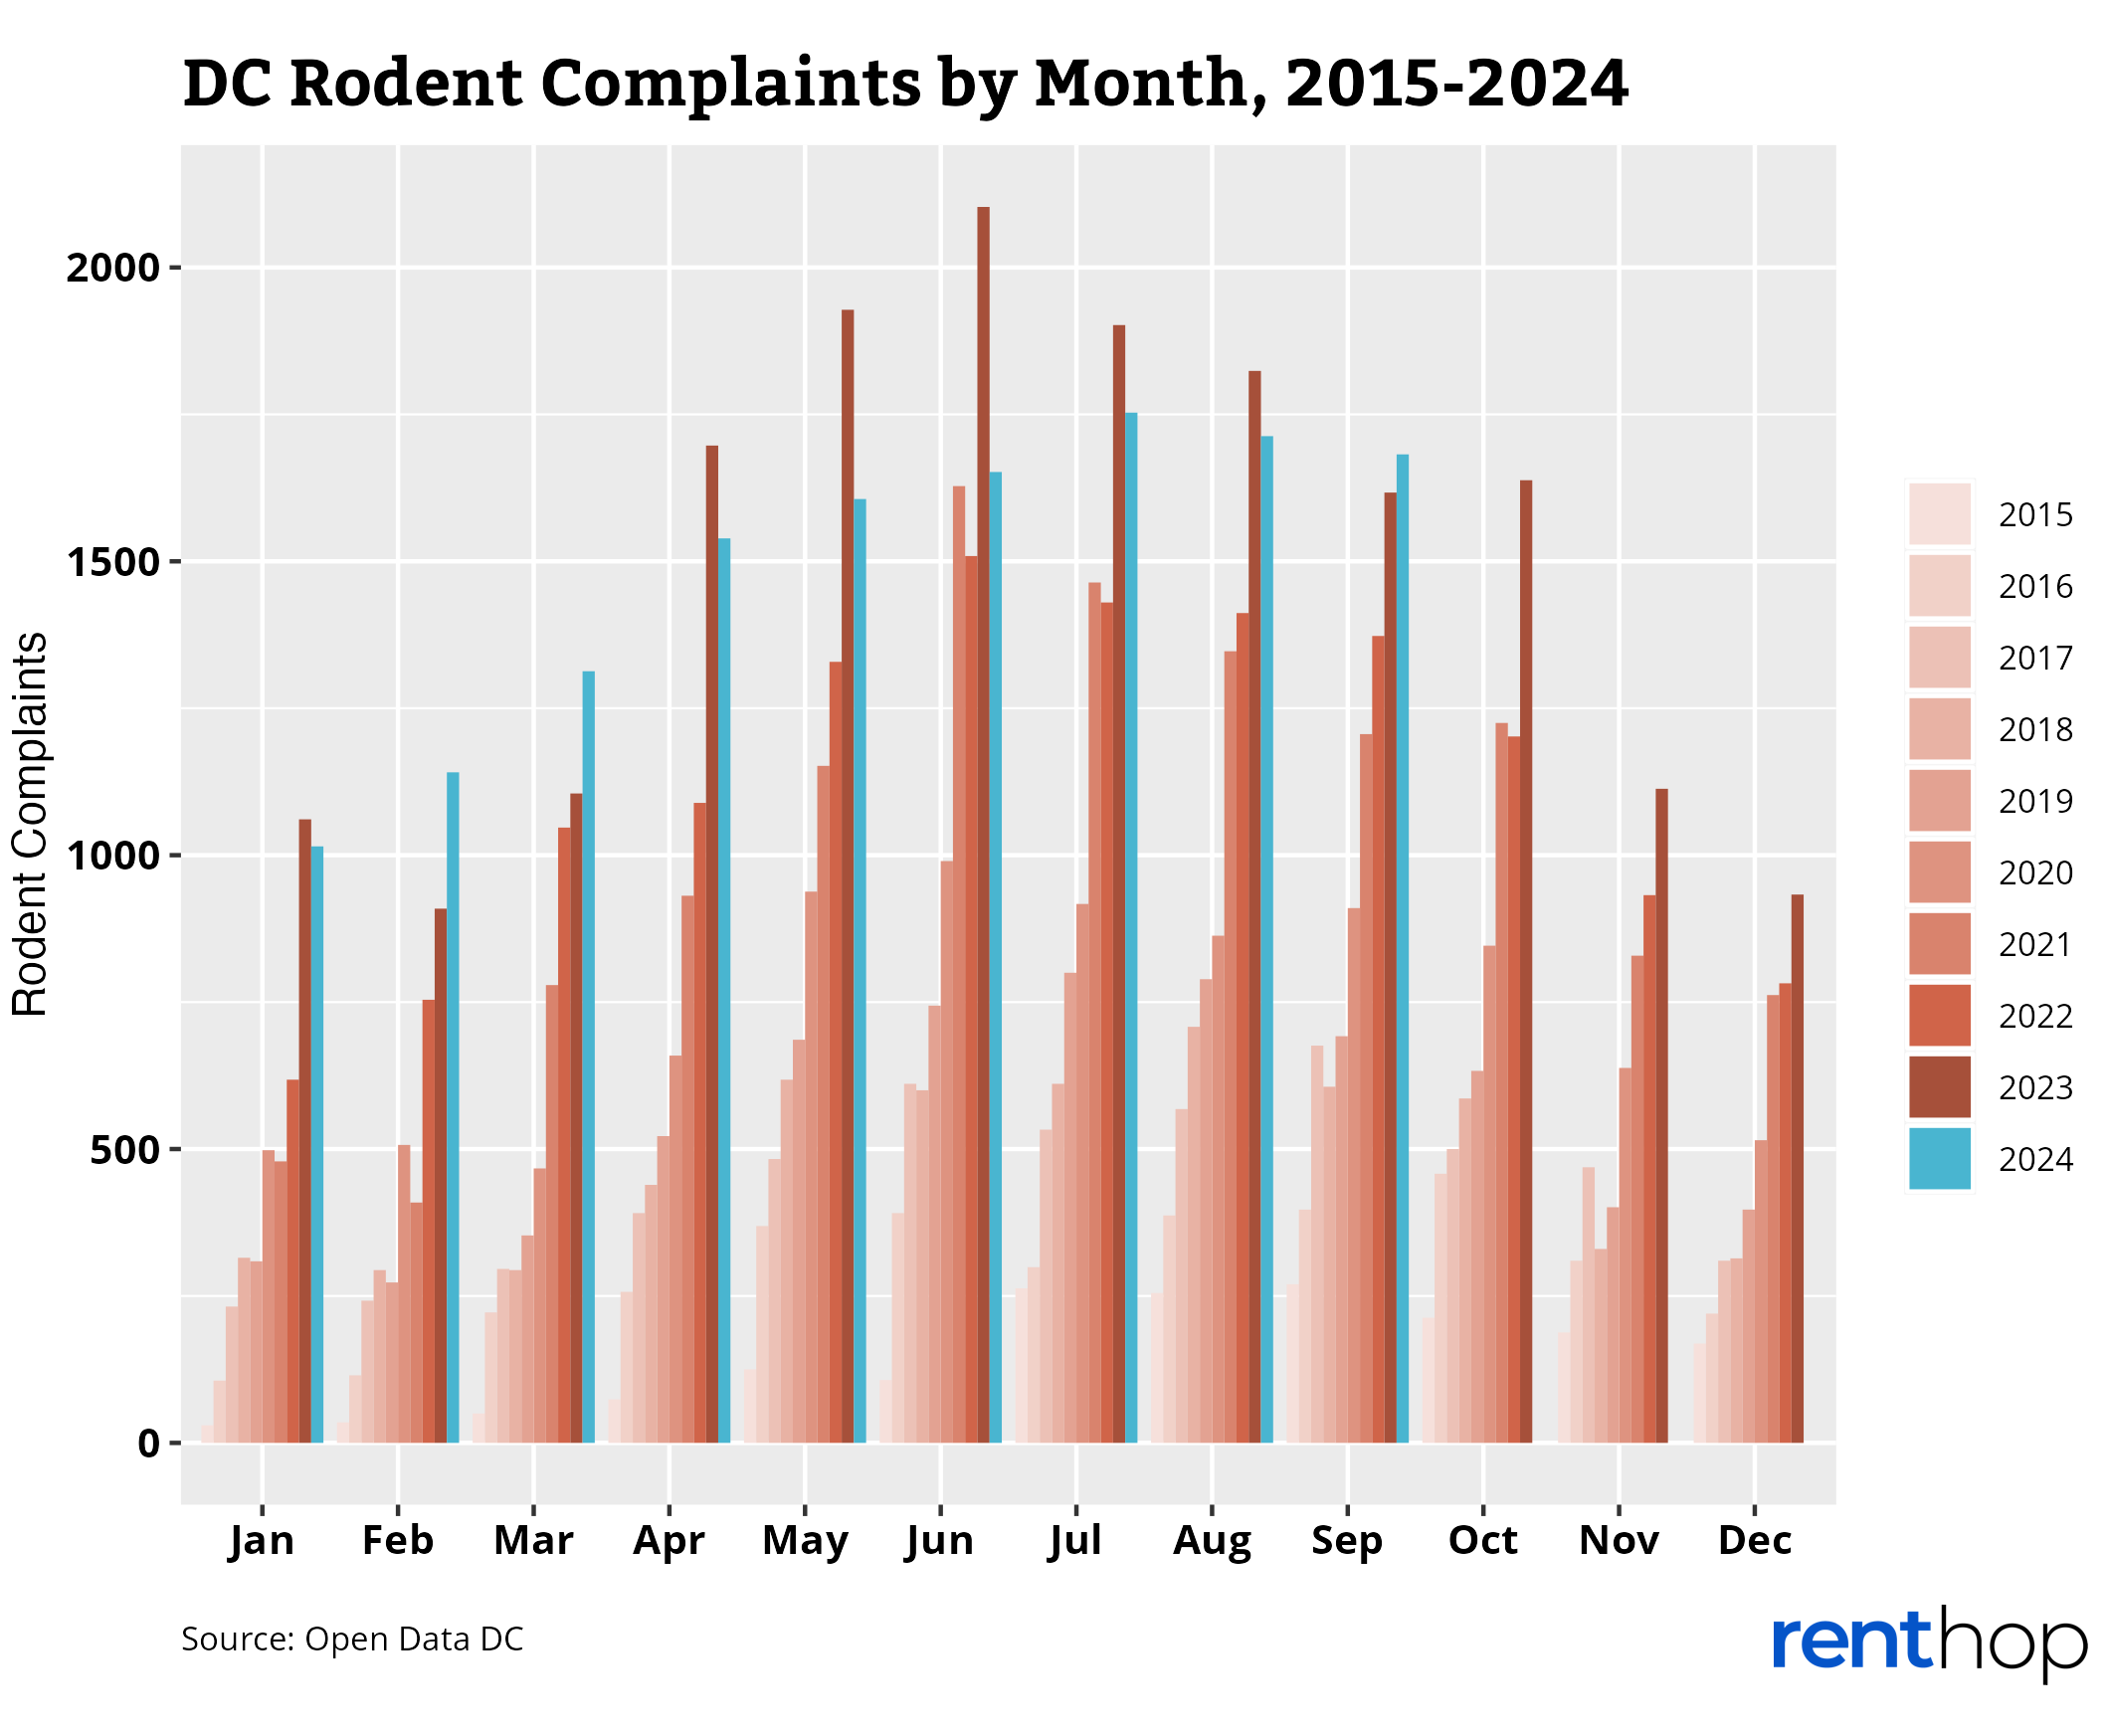
Residents filed 3.94% more complaints in September this year than last year, and it’s possible this upward trend could continue throughout the rest of the year. While the city remains aware of its rat problem, they must find a way to contain their dumpsters and cut off the food supply for a growing population.
Are Rats in Control in Your Neighborhood?
The interactive map below indicates the concentration of 311 rat/rodent sighting complaints in Washington, D.C. Neighborhoods in darker shades have a higher concentration of complaints in 2024. Larger neighborhoods may receive more complaints than smaller neighborhoods, so we normalized the number of rodent complaints by population (10,000 residents). You can click on the polygons to learn more about each neighborhood.
Edgewood, Bloomingdale, Truxton Circle, Eckington is the most rodent-infested neighborhood in the city, with 1,383 complaints so far this year, or 510.14 complaints per 10,000 residents. Neighborhoods along the northern border of D.C. witnessed sharp rodent population growth, with rats increasing by up to 190%. Along the southern border, many neighborhoods watched the rodent populations decrease from last year.
Washington D.C. Neighborhoods with the Most Rodent Complaints in 2024:
- Edgewood, Bloomingdale, Truxton Circle, Eckington – 1,383 complaints in 2024, 510.14 complaints/10k population
- Brightwood Park, Crestwood, Petworth – 1,540 complaints in 2024, 381.14 complaints/10k population
- Howard University, Le Droit Park, Cardozo/Shaw – 588 complaints in 2024, 362.23 complaints/10k population
- Columbia Heights, Mt. Pleasant, Pleasant Plains, Park View – 1,832 complaints in 2024, 359.46 complaints/10k population
- Shaw, Logan Circle – 692 complaints in 2024, 328.18 complaints/10k population
Rat Complaints Increased the Most Here:
- North Cleveland Park, Forest Hills, Van Ness – 10 complaints in 2023, 29 in 2024 (+190%)
- Saint Elizabeths – 2 complaints in 2023, 4 in 2024 (+100%)
- Hawthorne, Barnaby Woods, Chevy Chase – 25 complaints in 2023, 48 in 2024 (+92%)
- Colonial Village, Shepherd Park, North Portal Estates – 8 complaints in 2023, 14 in 2024 (+75%)
- North Michigan Park, Michigan Park, University Heights – 283 complaint in 2023, 380 in 2024 (+34.3%)
These Neighborhoods Saw the Sharpest Decline in Complaints:
- Fairfax Village, Naylor Gardens, Hillcrest, Summit Park – 19 complaints in 2023, 11 in 2024 (-42.1%)
- Douglas, Shipley Terrace – 62 complaints in 2023, 38 in 2024 (-38.7%)
- Sheridan, Barry Farm, Buena Vista – 50 complaints in 2023, 32 in 2024 (-36%)
- Capitol Hill, Lincoln Park – 886 complaints in 2023, 581 in 2024 (-34.4%)
- Eastland Gardens, Kenilworth – 3 complaints in 2023, 2 in 2024 (-33.3%)
Residents Complain about Rats Most Often as These D.C. Addresses:
- 1350 Pennsylvania Ave NW, 20004 – 40 rodent complaints
- 3305 Ames St NE, 20019 – 26 rodent complaints
- 35 T St NE, 20002 – 22 rodent complaints
- 1802 Wyoming Ave NW, 20009 – 22 rodent complaints
- 3431 Eads St NE, 20019 – 19 rodent complaints
Methodology
This study examines the rodent crisis in major U.S. cities, using 311 data from Boston, Chicago, New York City, and Washington D.C., and the population data was collected via the U.S. Census Bureau. For this study, we limited the research time frame to January 2015 through September 2024. We then geocoded the complaints using each city’s neighborhood shapefile and normalized the complaint count by population count. This allows us to fairly rank each neighborhood and provide better insights.
RentHop is all about data and facts. Our data science team conducts annual studies on rental data as well as 311 complaints across major U.S. cities. To get to know the city you live in, take a look at our previous studies on rodent complaints, human/animal waste complaints, noise complaints, and more.
Please contact press@renthop.com for any questions.


